Figures
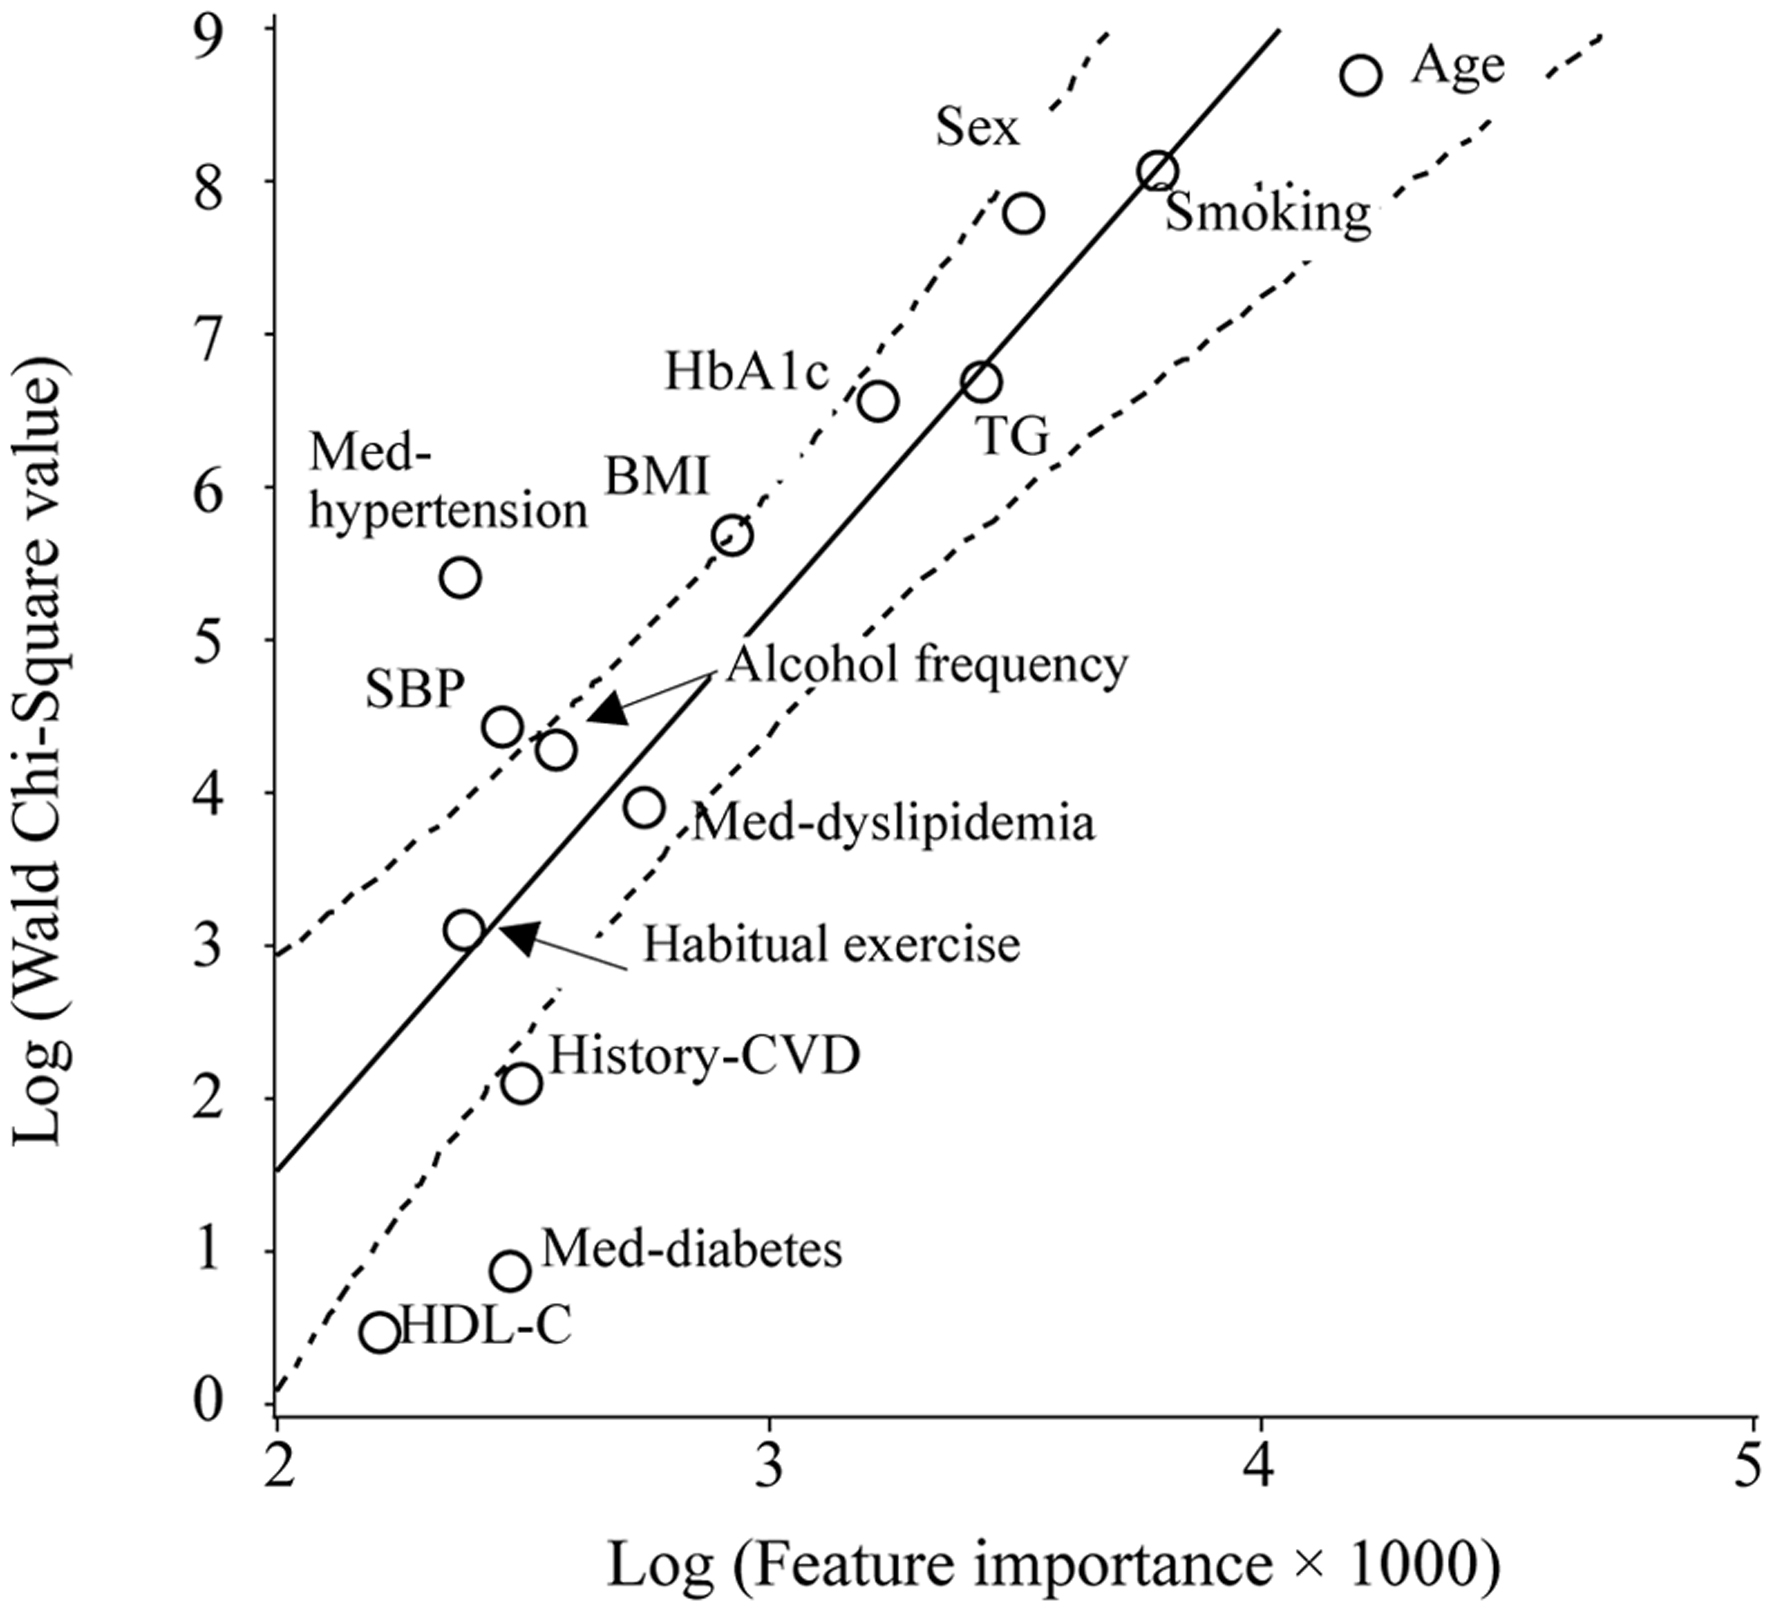
↓ Figure 1. Scatter plot of the natural logarithm
of the WCS values and FI for the outcome of a 10% increase in bodyweight over 10 years. The WCS values
of the age, smoking status, sex, TG and HbA1c levels, BMI, pharmacotherapy for hypertension, systolic
blood pressure, weekly alcohol consumption, pharmacotherapy for dyslipidemia, habitual exercise status,
history of cardiovascular disease, pharmacotherapy for diabetes, and HDL-C level are 5,903, 3,170,
2,414, 800, 701, 293, 221, 83, 71, 50, 22, 8, 2, and 2, respectively. The solid and dotted lines
represent the regression line and 95% CI, respectively.
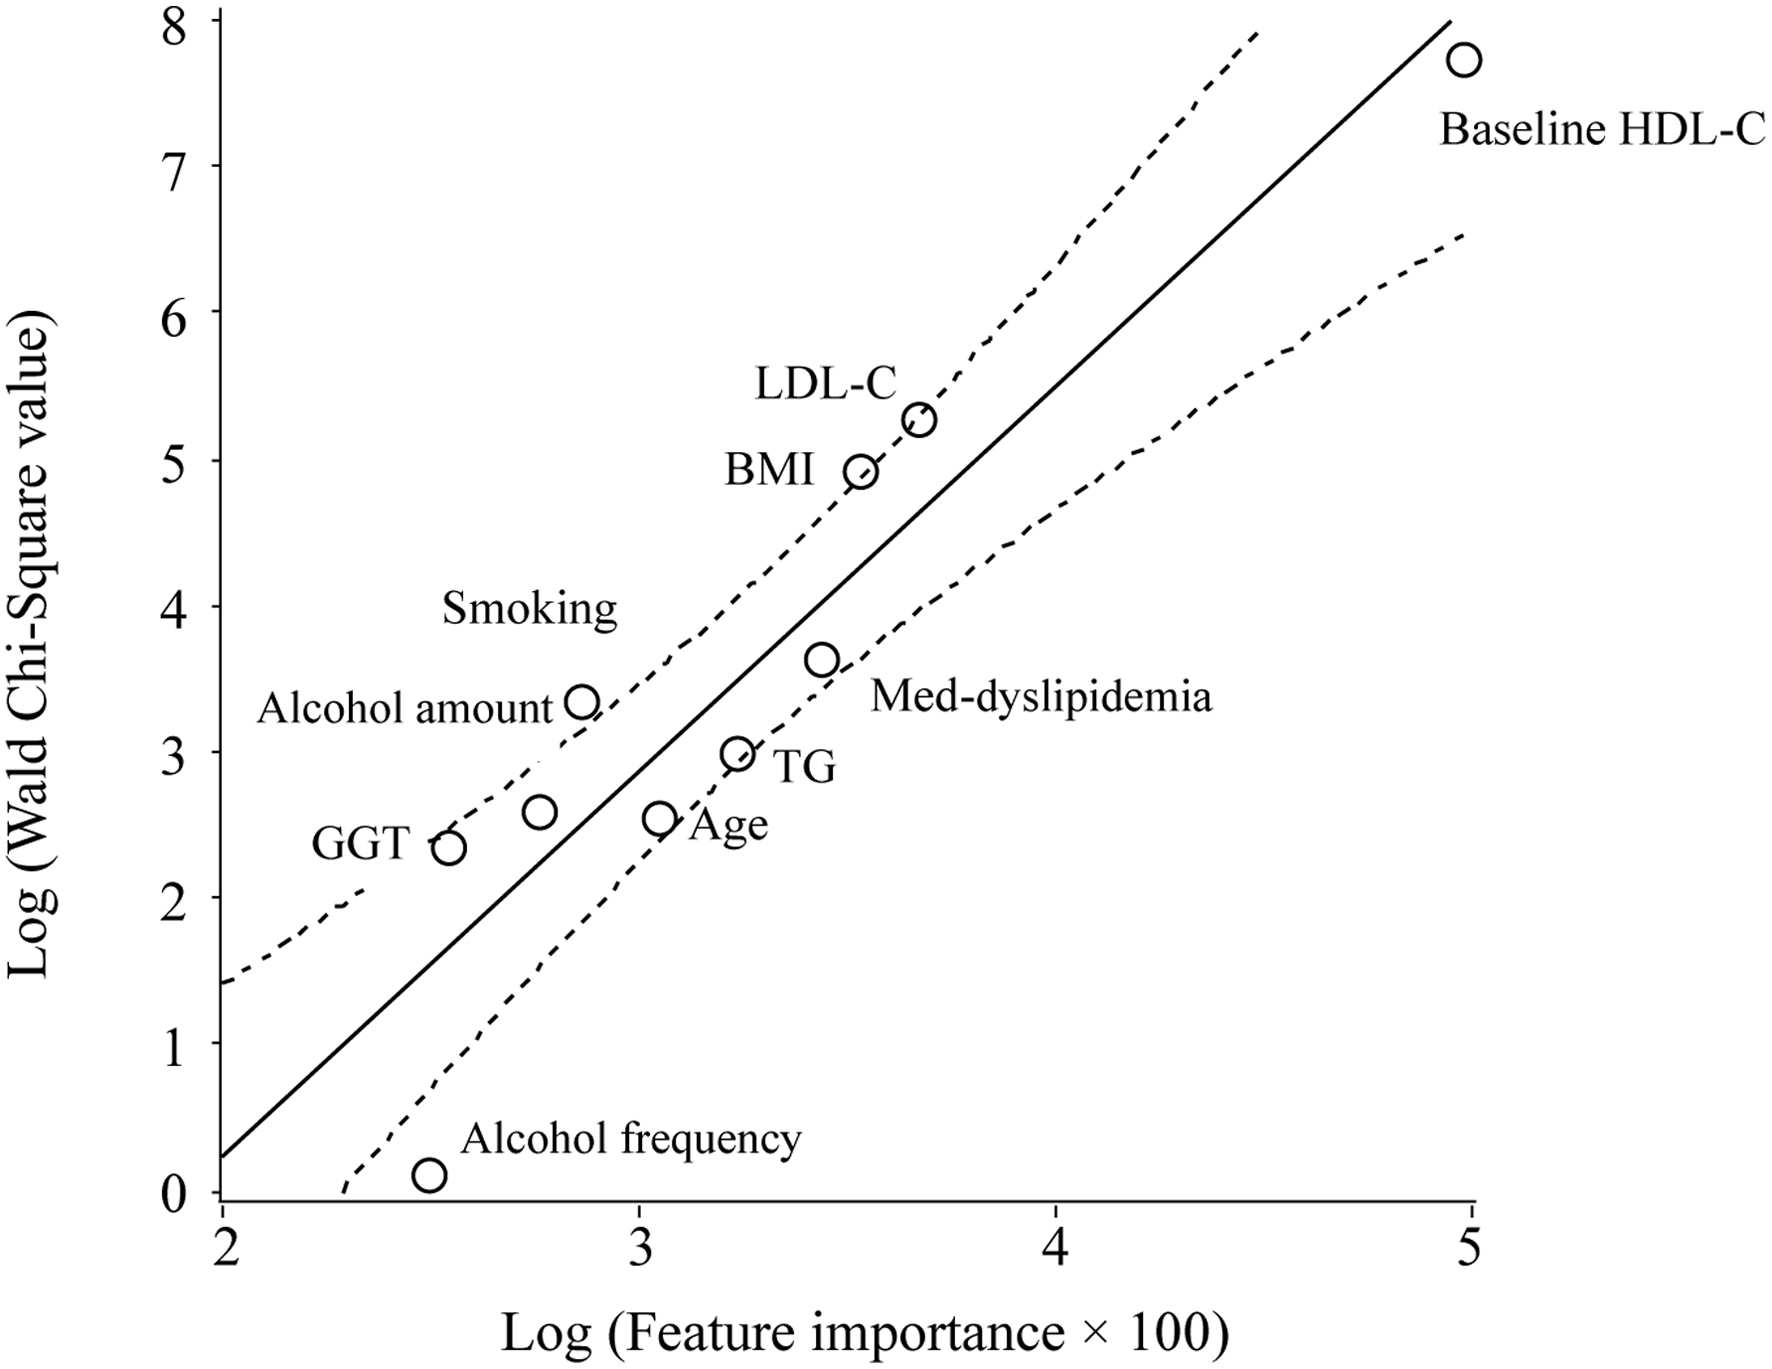
↓ Figure 2. Scatter plot of the natural logarithm
of the WCS values and FI for the outcome of a decrease of 10 mg/dL or more in the HDL-C level over 10
years. The WCS values of the HDL-C and LDL-C levels, BMI, pharmacotherapy for dyslipidemia, TG level,
age, smoking status, amount of alcohol consumed per session, GGT level, and weekly alcohol consumption
are 2,282, 193, 134, 38, 19, 13, 28, 13, 10, and 1, respectively. The solid and dotted lines represent
the regression line and 95% CI, respectively.
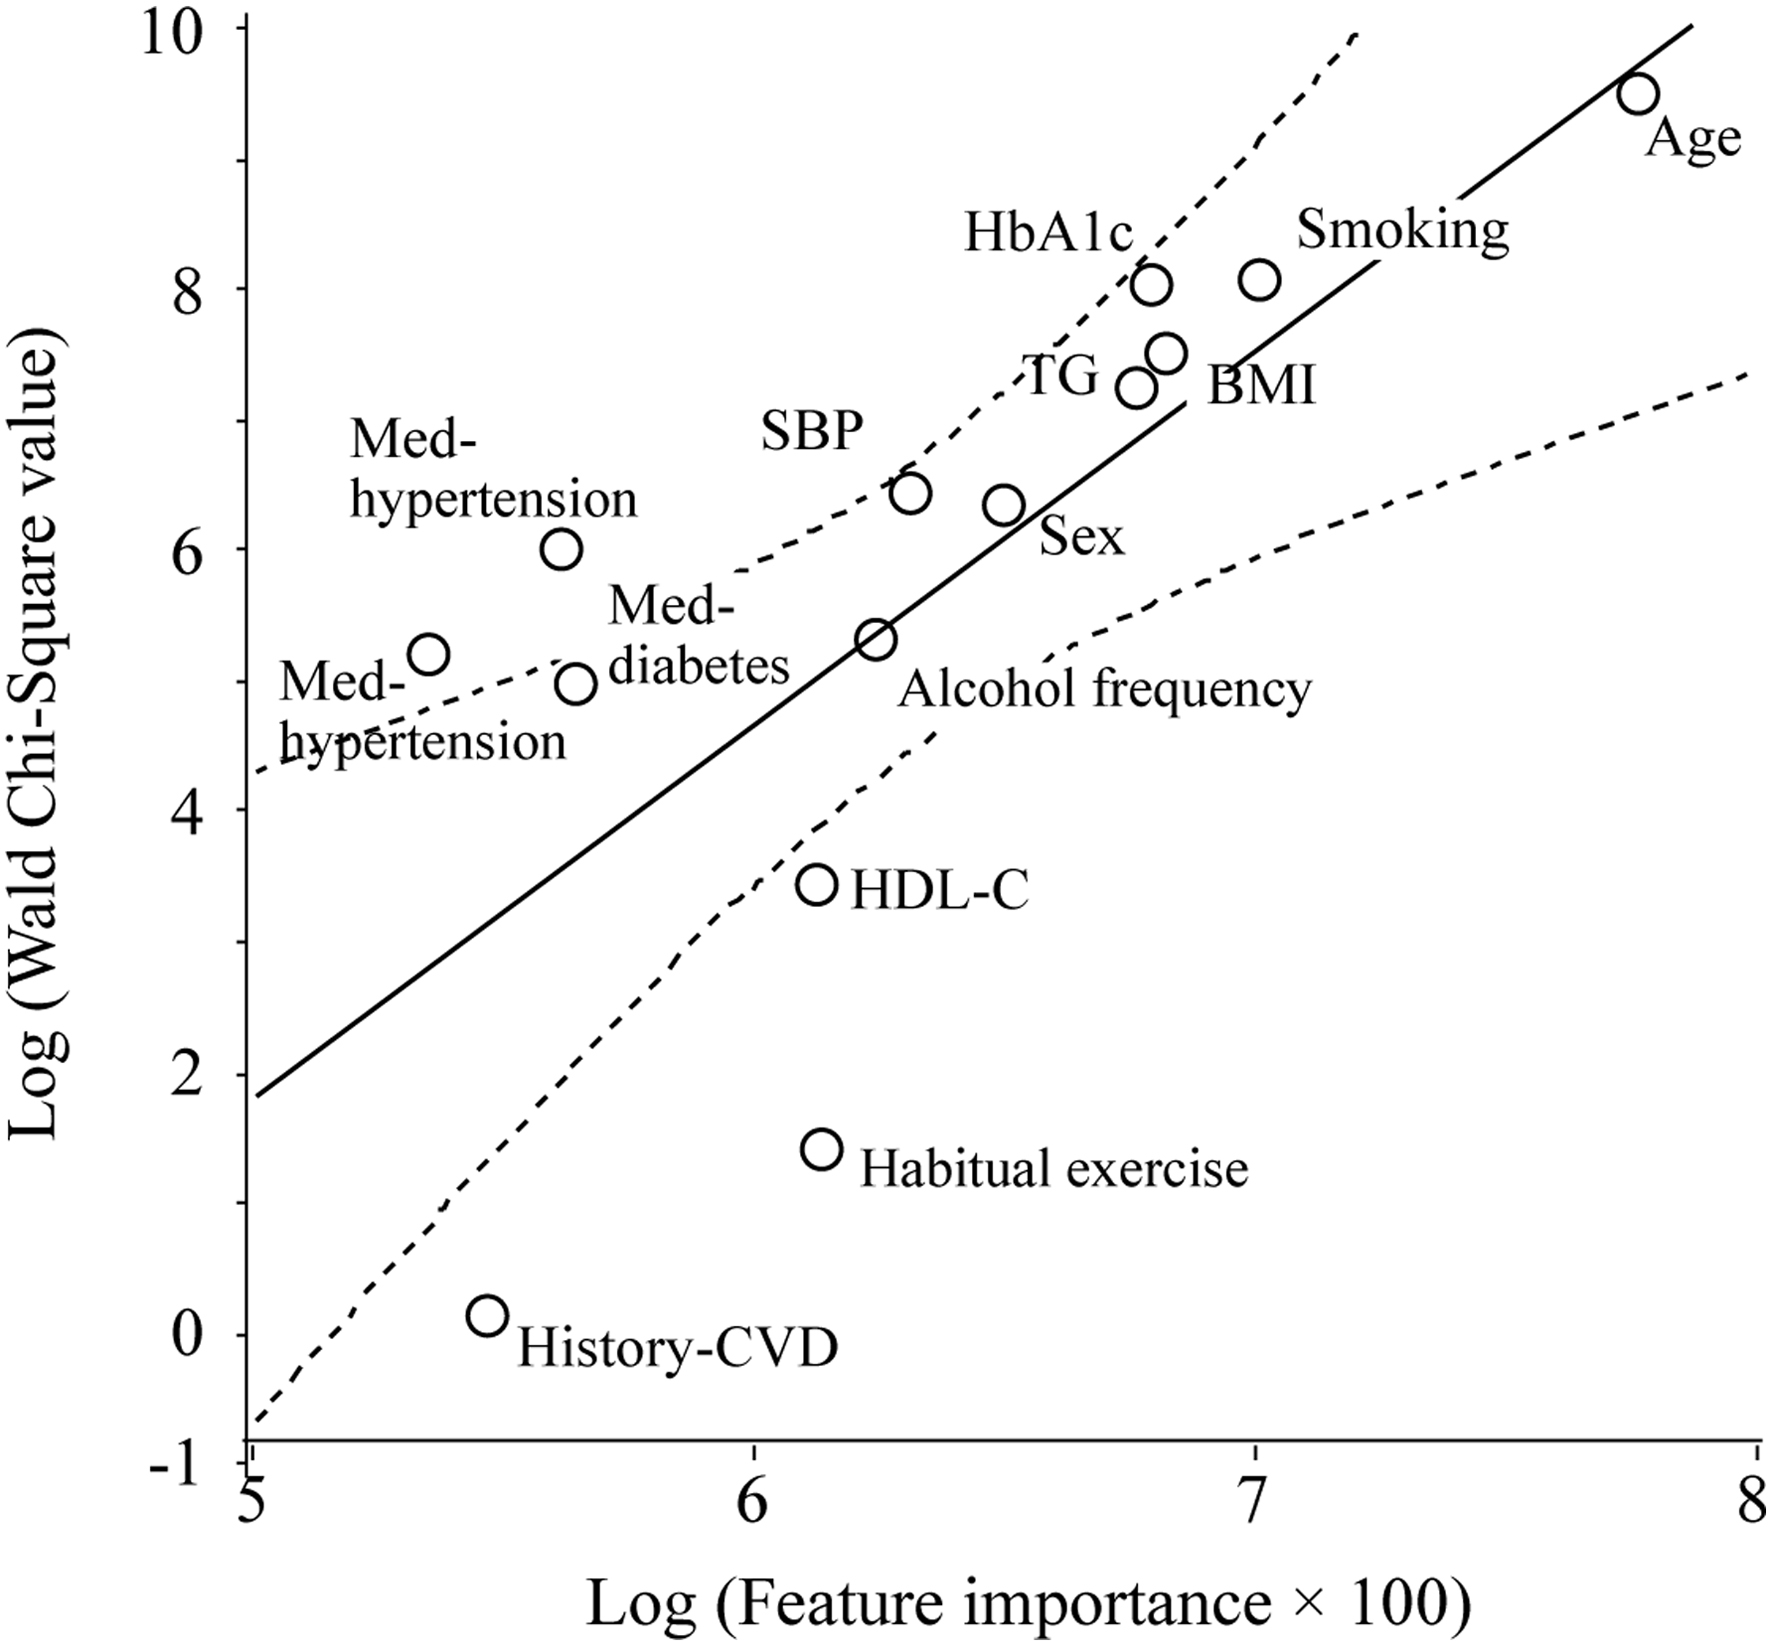
↓ Figure 3. Scatter plot of the natural logarithm
of the WCS values and FI for the outcome of a percentage (%) change in bodyweight over 10 years, as
analyzed using a GLM. The WCS values of the age, smoking status, HbA1c level, BMI, TG level, systolic
blood pressure, sex, pharmacotherapy for hypertension, weekly alcohol consumption, pharmacotherapies for
diabetes and dyslipidemia, HDL-C level, habitual exercise status, and history of cardiovascular disease
are 12,979, 2,996, 2,835, 1,676, 1,310, 578, 505, 360, 177, 161, 126, 26, 3, and 1, respectively. The
solid and dotted lines represent the regression line and 95% CI, respectively.
Tables
↓ Table 1. Correlation of FI With WCS and stB
|
FI |
|
Study 1 (n = 615,077 (R)a) |
Study 2 (n = 10,189 (R)a) |
Study 3 (n = 615,077 (R)b) |
| aMultivariable logistic regression model. bGeneralized linear
model. cCorrelation coefficients by Spearman correlation. AUC: area under the curve; FI:
feature importance; HDL-C: high-density lipoprotein cholesterol; stB: standardized
β-coefficient; WCS: Wald Chi-squared. |
| Outcome |
10% body weight increase (dichotomized variable) |
Decrease of HDL-C ≥ 10 mg/dL (dichotomized variable) |
Body weight increase (%) (continuous variable) |
| Number of explanatory factors |
14 |
10 |
14 |
| AUC, % |
68.5% |
68.4% |
- |
| WCS |
|
|
|
| Correlation coefficientsc |
0.84 |
0.94 |
0.87 |
| P values |
0.0002 |
< 0.0001 |
< 0.0001 |
| stB |
|
|
|
| Correlation coefficientsc |
0.80 |
0.73 |
0.85 |
| P values |
0.0006 |
0.016 |
0.0001 |
↓ Table 2. Results of Logistic Regression Analysis After Standardization
of Covariates and FI by Machine Learning
|
|
stB
|
Absolute stB |
WCS
value |
FI
|
| The factors are listed in descending order according the value of WCS.
aObesity; BMI ≥ 30 kg/m2, non-obesity; BMI < 30 kg/m2.
AUC: area under the curve; FI: feature importance; HbA1c: glycated hemoglobin; stB: standardized
β-coefficient; WCS: Wald Chi-squared. Genetic information was excluded due to large
standardized β in the study 5. |
| Study 4: Medical students (Outcome: high systolic blood
pressure ≥ 130 mm Hg) |
| Heart rate |
0.0316 |
0.0316 |
7.7561 |
0.0102 |
| Cholesterol |
-0.0253 |
0.0253 |
4.994 |
0.0113 |
| Sex (men 1, women 2) |
0.0218 |
0.0218 |
3.7034 |
0.0090 |
| Obesity (obesity 1, non-obesity 0)a |
-0.0211 |
0.0211 |
3.3696 |
0.0101 |
| Smoking (smoker 1, non-smoker 0) |
0.0197 |
0.0197 |
3.1051 |
0.0057 |
| Age |
-0.0093 |
0.0093 |
0.6682 |
0.0095 |
| Diabetes (diabetes 1, non-diabetes 0) |
-0.0023 |
0.0023 |
0.0400 |
0.0055 |
| AUC, % |
|
|
51.6 |
54.2 |
| Study 5: Permanent neonatal diabetes mellitus (Outcome:
permanent neonatal diabetes mellitus) |
| Age |
-1.7678 |
1.7678 |
4269.6724 |
0.1280 |
| Birth weight |
-0.6818 |
0.6818 |
1674.7298 |
0.0721 |
| Family history (yes 1, no 0) |
0.0262 |
0.0262 |
2.8333 |
0.0082 |
| HbA1c |
0.0191 |
0.0191 |
1.4634 |
0.0067 |
| Insulin level |
0.0105 |
0.0105 |
0.4450 |
0.0086 |
| Development delay (yes 1, no 0) |
0.0070 |
0.0070 |
0.1971 |
0.0056 |
| AUC, % |
|
|
87.5 |
70.2 |