Figures
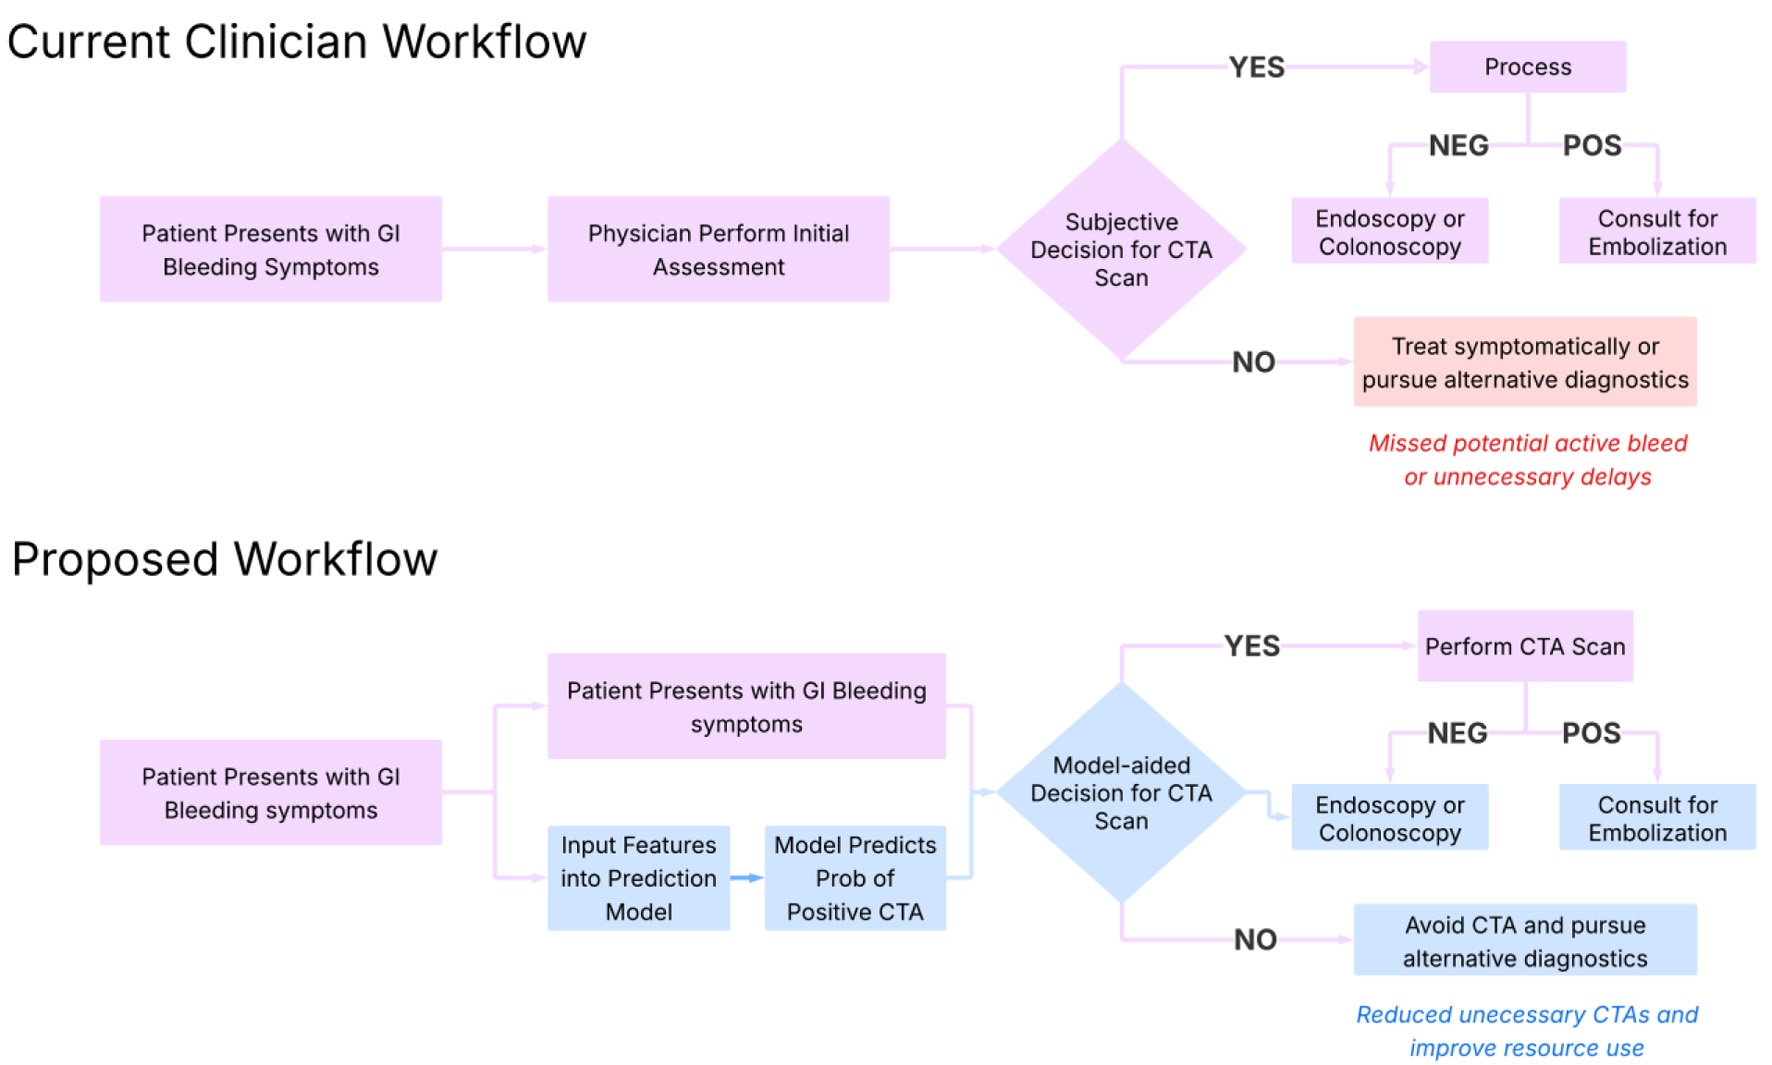
↓ Figure 1. Proposed clinical workflow for
implementation of the model. This diagram outlines a step-by-step integration of the machine learning
model into clinical practice. Starting with patient presentation and lab draw, the model ingests key
laboratory values (e.g., hemoglobin, INR, BUN) to generate a predicted probability of a positive CTA.
Based on this probability and clinical context, the model stratifies patients into high- and
low-likelihood categories, guiding providers on whether to pursue immediate CTA or consider alternative
diagnostics. This approach supports real-time, evidence-informed decision-making for intermediate-risk
cases. BUN: blood urea nitrogen; CTA: computed tomography angiography; INR: international normalized
ratio.
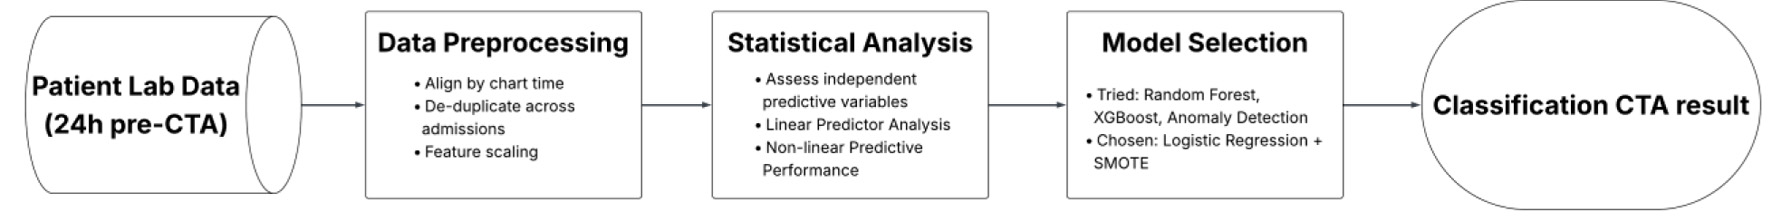
↓ Figure 2. Workflow for developing an
interpretable logistic regression model to assist CTA decision-making. This flowchart outlines the
sequential steps in developing an interpretable logistic regression model to assist CTA decision-making.
Using routinely available labs from 24 h prior to imaging, the workflow includes data preprocessing,
statistical evaluation of features, model selection with SMOTE upsampling, and final performance tuning
focused on sensitivity to minimize missed bleeds. CTA: computed tomography angiography; SMOTE: Synthetic
Minority Oversampling Technique.
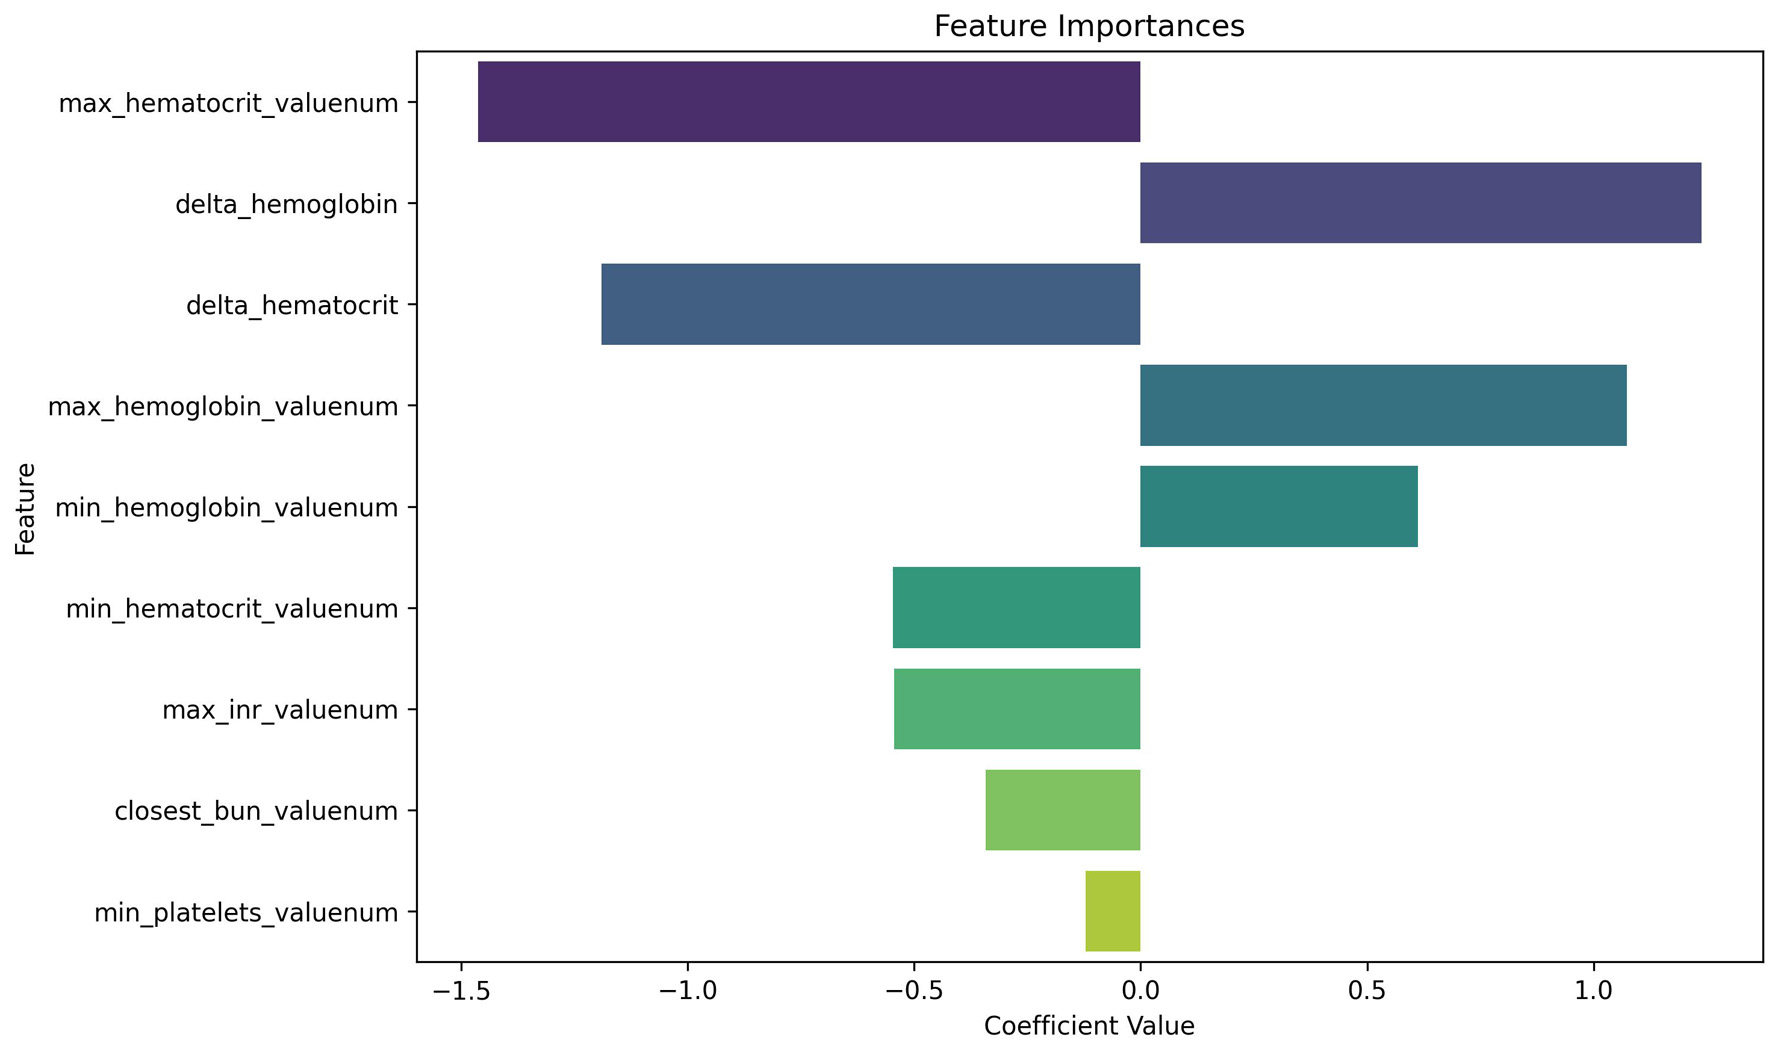
↓ Figure 3. Logistic regression coefficients for
predicting positive CTA. This plot displays the relative importance of laboratory features in the
logistic regression model. In our analysis, we use a random forest predictor for computing importance;
our findings therefore rely on random forest assumptions, including independence of variable shuffling.
Negative coefficients (left of zero) are associated with decreased likelihood of a positive CTA, while
positive coefficients (right of zero) increase predicted probability. Max hematocrit and delta
hemoglobin emerged as highly influential predictors, despite being statistically non-significant on
univariate analysis—highlighting the value of multivariable modeling. CTA: computed tomography
angiography.
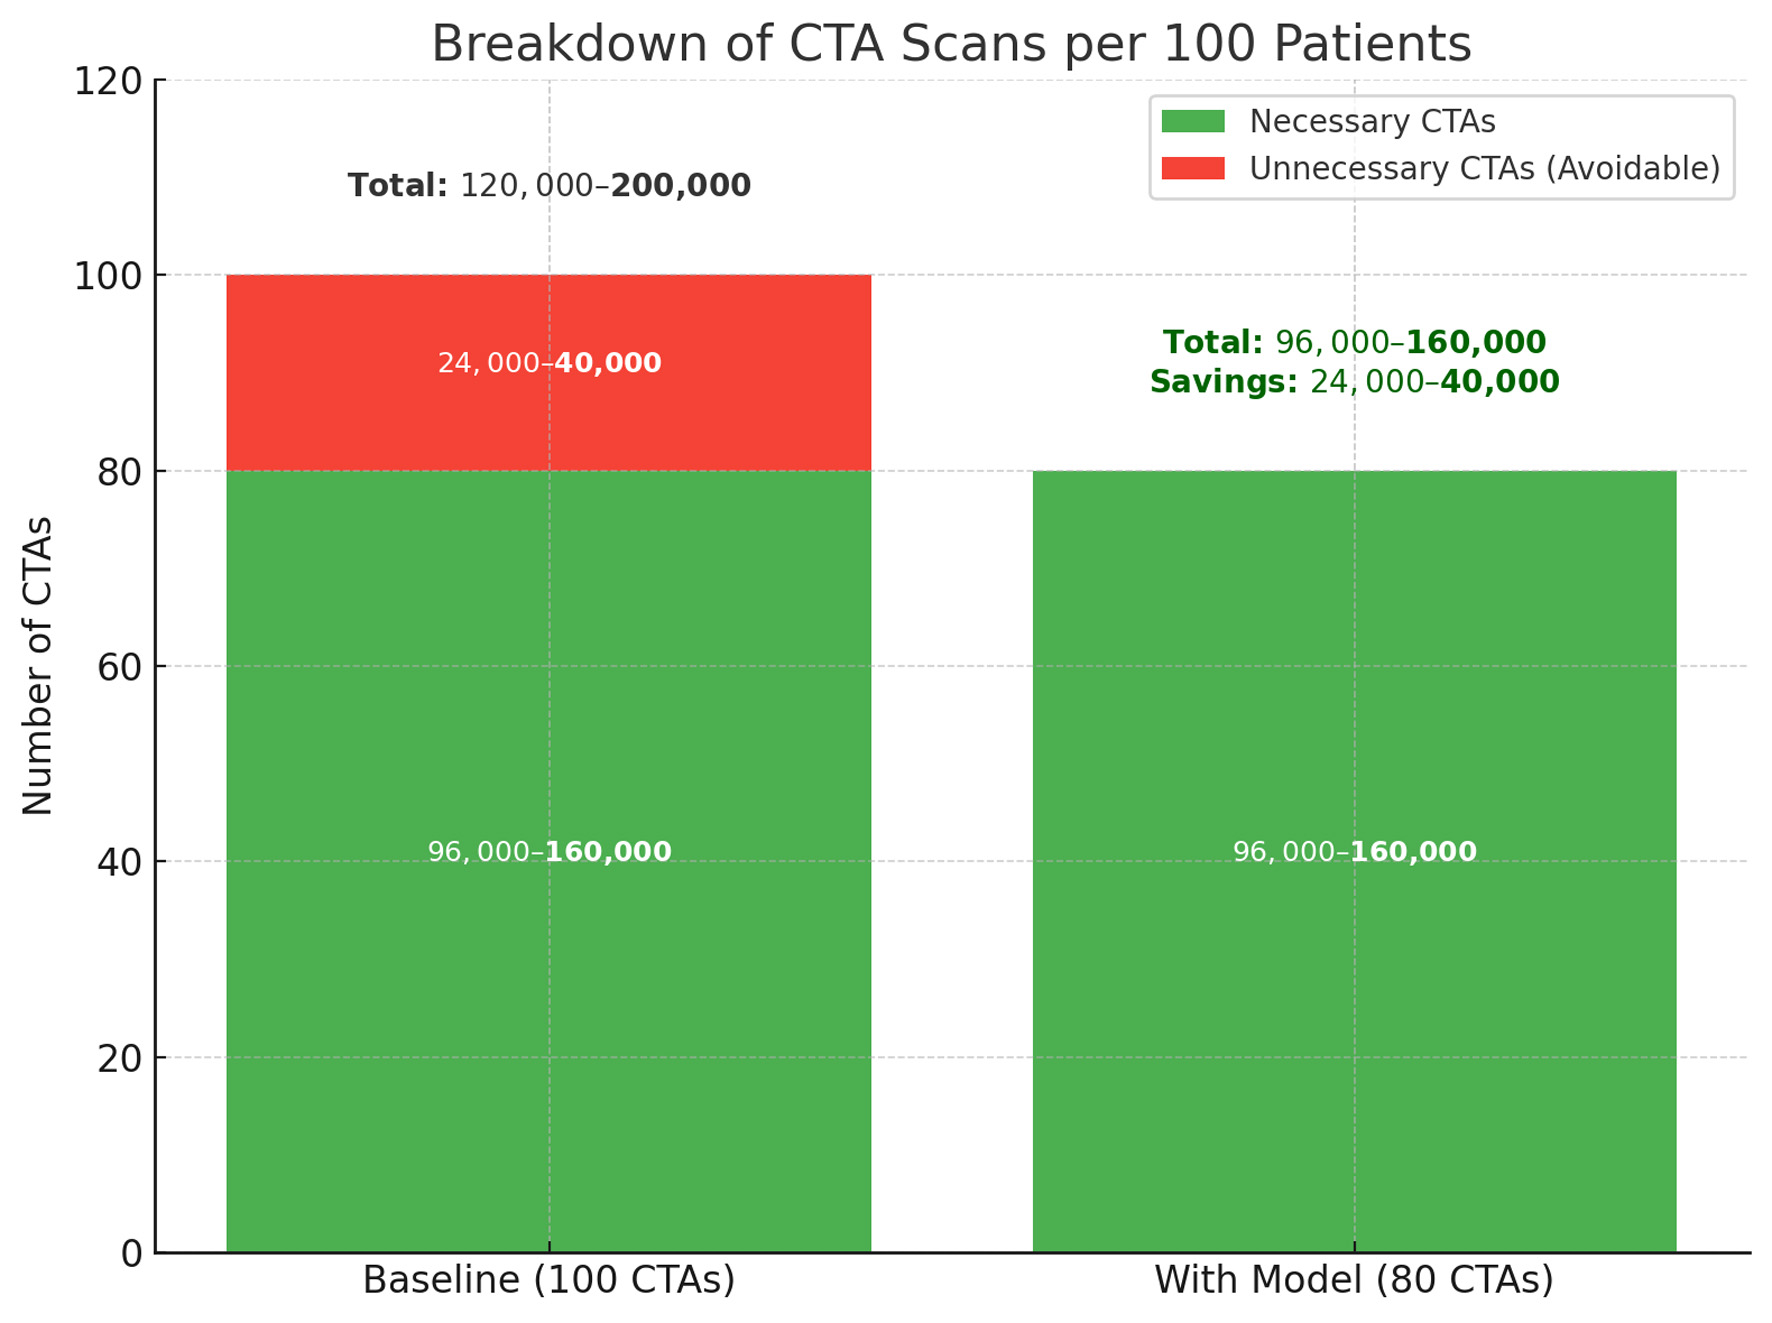
↓ Figure 4. Projected reduction in unnecessary
CTA scans with model implementation. The left column represents baseline imaging practice, where
24,000–40,000 of every 100,000 CTAs are estimated to be unnecessary. The right column shows the
anticipated effect of model-assisted triage, which reduces avoidable CTAs by 20% while preserving all
necessary scans. This change corresponds to a direct reduction in imaging volume, with estimated savings
between 24,000 and 40,000 scans per 100,000 patients. CTA: computed tomography angiography.
Tables
↓ Table 1. Univariate Statistical Findings and Model-Level Impact for
Candidate Predictors (24-h Pre-CTA)
|
Feature |
Definition (window) |
t-test P |
Mann-Whitney P |
Cohen’s d |
Bayesian P(mean diff > 0) |
Mean
diff (95% CI) |
Permutation importance |
Importance in final model |
| Continuous features were assessed with independent-samples t-tests and
Mann–Whitney U tests; effect size (Cohen’s d) and Bayesian posterior probability of a
positive mean difference are reported. Non-linear predictive contribution was estimated via
random-forest permutation importance. Notably, Δ-hemoglobin demonstrated a moderate predictive
trend in isolation, while Δ-hematocrit was not significant univariately but later emerged as a
high-impact contributor in the final model. The feature Max INR consistently emerged as the most
robust predictor across statistical tests, Bayesian analysis, and effect size calculations. This
illustrates how certain features may lack standalone power yet contribute meaningfully in
multivariable contexts. The discrepancy between raw statistical significance and feature importance
highlights the potential for complex collinearity and reinforces the value of structured feature
engineering when developing interpretable predictive models. In the final logistic model, maximum
hematocrit was the strongest predictor, with Δ-hemoglobin and Δ-hematocrit also highly
influential, whereas maximum INR was the only feature with significant univariate separation. BUN:
blood urea nitrogen; CI: confidence interval; CTA: computed tomography angiography; Hb: hemoglobin;
Hct: hematocrit; INR: international normalized ratio; Plt: platelets. |
| Max INR |
Peak INR |
0.0098 |
0.0836 |
0.3443 |
0.00 |
−0.31 (−0.54, −0.08) |
0.052 |
High (top tier) |
| Closest BUN |
Closest BUN to order time |
0.1196 |
0.6319 |
0.2529 |
0.06 |
−4.99 (−11.22, 1.23) |
0.052 |
Moderate |
| Max Hct |
Highest Hct |
0.2480 |
0.1609 |
0.2450 |
0.12 |
−1.43 (−3.83, 0.97) |
0.090 |
Highest (rank-1) |
| Min Hct |
Lowest Hct |
0.2250 |
0.1494 |
0.2537 |
0.11 |
−1.56 (−4.05, 0.93) |
— |
Moderate |
| Δ-Hb |
Max−Min Hb |
0.4174 |
0.4036 |
−0.1754 |
0.79 |
0.21 (−0.30, 0.72) |
0.041 |
High (top tier) |
| Δ-Hct |
Max−Min Hct |
0.8652 |
0.8993 |
−0.0356 |
0.57 |
0.13 (−1.36, 1.62) |
— |
High (top tier) |
| Min Hb |
Lowest Hb |
0.4573 |
0.2501 |
0.1608 |
0.23 |
−0.35 (−1.27, 0.57) |
— |
Low |
| Max Hb |
Highest Hb |
0.7525 |
0.5128 |
0.0679 |
0.38 |
−0.14 (−1.01, 0.73) |
— |
Low |
| Min Plt |
Lowest Plt |
0.6674 |
0.9706 |
0.0773 |
0.33 |
−8.40 (−46.57, 29.76) |
< 0.01 |
Low |
↓ Table 2. Performance Metrics Across Classification and Anomaly Detection
Models for Predicting CTA-Positive GI Bleeding
|
Model |
Accuracy |
Precision |
Recall |
F1
|
ROC-AUC |
| This table presents accuracy, precision, recall, F1 score, and ROC-AUC for both
traditional classification models and unsupervised anomaly detection approaches. Among classifiers,
logistic regression with SMOTE upsampling yielded the best overall balance across metrics, achieving
the highest precision (0.82), F1 score (0.71), and ROC-AUC (0.71). While random forest had higher
recall (0.75), it showed lower precision, suggesting over-identification of positives. In contrast,
anomaly detection models demonstrated near-perfect precision and recall—but with low ROC-AUC,
indicating poor discrimination likely due to class imbalance and lack of labeled signal. These
findings emphasize the challenge of low-prevalence detection in small datasets and highlight the
potential utility of structured upsampling in improving model robustness. CTA: computed tomography
angiography; ROC-AUC: area under the receiver operating characteristic curve; SMOTE: Synthetic
Minority Oversampling Technique. |
| Evaluation metrics for classification models |
|
|
|
|
|
| Naive logistic regression |
0.64 |
0.72 |
0.64 |
0.67 |
0.73 |
| *With ADASYN upsampling |
0.64 |
0.81 |
0.64 |
0.67 |
0.70 |
| *With SMOTE upsampling |
0.68 |
0.82 |
0.68 |
0.71 |
0.71 |
| Random forest |
0.75 |
0.61 |
0.75 |
0.67 |
0.61 |
| XGBoost |
0.64 |
0.59 |
0.64 |
0.61 |
0.5 |
| Evaluation metrics for anomaly detection models |
|
|
|
|
|
| AutoEncoder |
0.95 |
0.99 |
0.95 |
0.97 |
0.54 |
| One-class SVM |
0.99 |
0.99 |
0.99 |
0.99 |
0.51 |
| Isolation forest |
0.99 |
0.99 |
0.99 |
0.99 |
0.50 |
↓ Table 3. Multivariable Standardized Logistic Regression Coefficients and
Odds Ratios for Model Predicting CTA Positivity
|
Feature |
Definition (window) |
Logistic coefficient (β) |
Standard error |
Z
statistic |
P-value |
Odds
ratio (OR) |
95%
CI (lower) |
95%
CI (upper) |
| Table 3 reports coefficients and odds ratios from the final multivariable standardized
logistic regression model used to predict CTA positivity. All continuous predictors were
standardized prior to model fitting; therefore, odds ratios correspond to a one–standard
deviation increase in each laboratory variable rather than a one-unit change. Standard errors,
confidence intervals, and P-values are reported only for variables with reliably estimable variance.
For several hemoglobin- and hematocrit-derived features, substantial multicollinearity prevented
stable estimation of standard errors, and corresponding inferential statistics are not shown. Odds
ratios for these variables should therefore be interpreted as descriptive of model behavior rather
than independent inferential estimates. BUN: blood urea nitrogen; CI: confidence interval; CTA:
computed tomography angiography; Hb: hemoglobin; Hct: hematocrit; INR: international normalized
ratio; Plt: platelets. |
| Max INR |
Peak INR |
–0.5441 |
0.3362 |
–1.6184 |
0.1056 |
0.5803 |
0.3003 |
1.1217 |
| Closest BUN |
Closest BUN to order time |
–0.3422 |
0.2120 |
–1.6140 |
0.1065 |
0.7102 |
0.4687 |
1.0761 |
| Max Hct |
Highest Hct |
–1.4636 |
— |
— |
— |
0.2314 |
— |
— |
| Min Hct |
Lowest Hct |
–0.5466 |
— |
— |
— |
0.5789 |
— |
— |
| Δ-Hb |
Max−Min Hb |
1.2389 |
— |
— |
— |
3.4518 |
— |
— |
| Δ-Hct |
Max−Min Hct |
–1.1907 |
— |
— |
— |
0.3040 |
— |
— |
| Min Hb |
Lowest Hb |
0.6127 |
— |
— |
— |
1.8454 |
— |
— |
| Max Hb |
Highest Hb |
1.0741 |
— |
— |
— |
2.9275 |
— |
— |
| Min Plt |
Lowest Plt |
–0.1214 |
0.2093 |
–0.5801 |
0.5619 |
0.9957 |
0.5877 |
1.3348 |