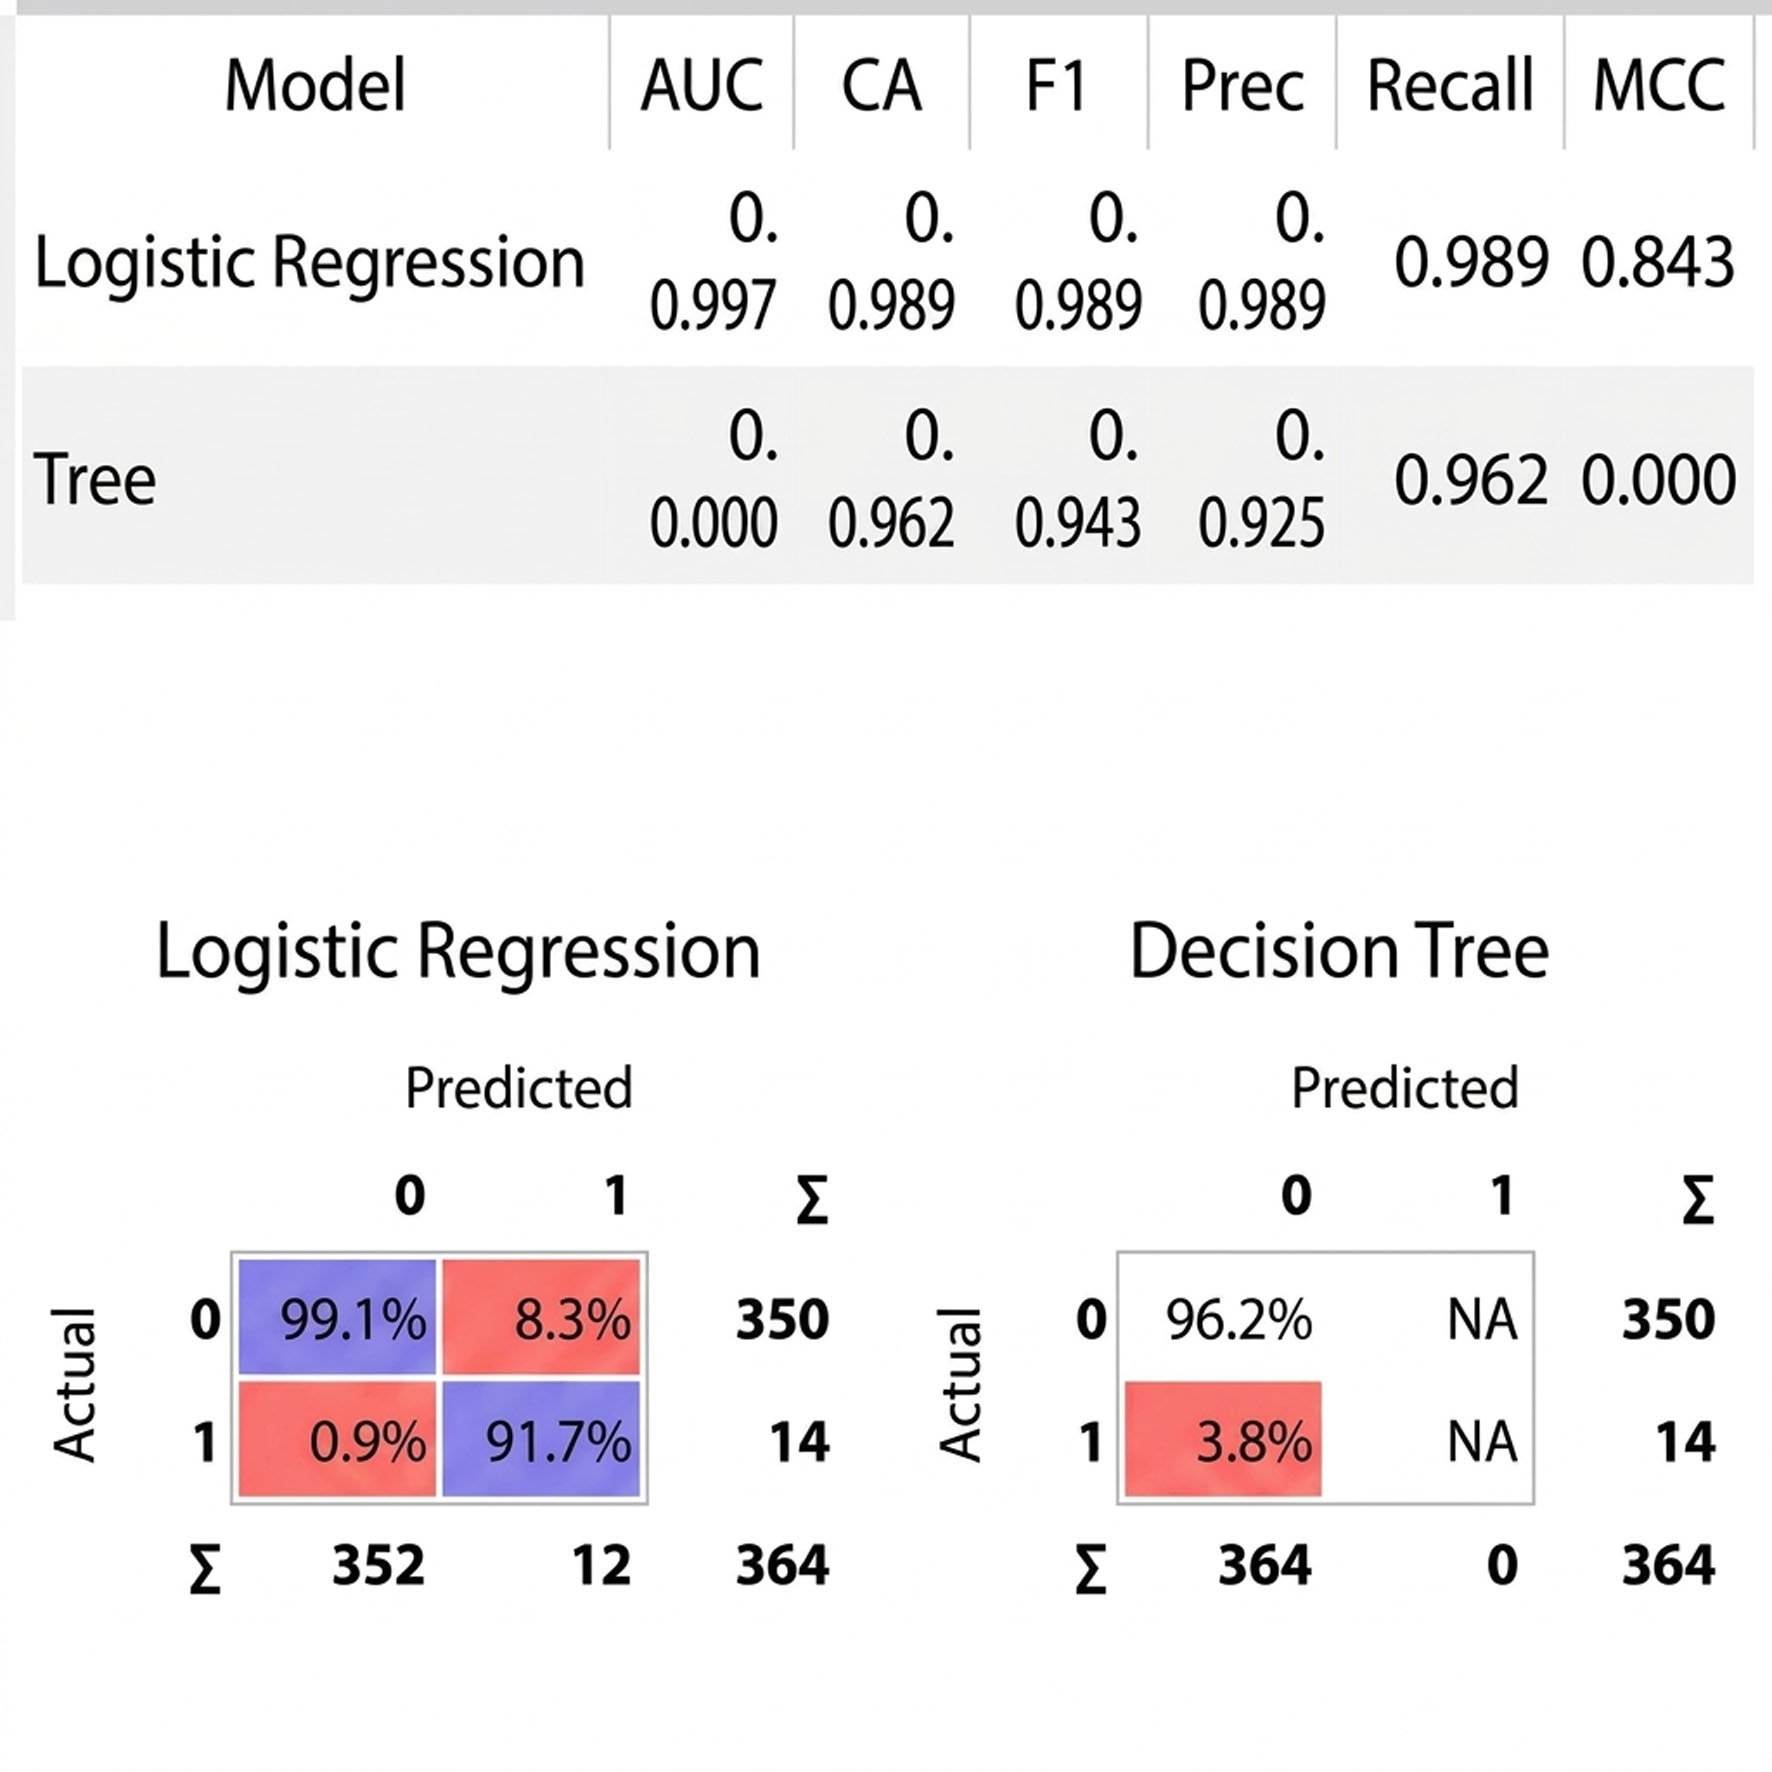
↓ Figure 1. Schematic illustration of the visual programming workflow implemented in the Orange Data Mining framework. Schematic of the visual programming pipeline used for end-to-end predictive model development. The workflow illustrates data ingestion and exploratory analysis (upper branches), internal model training and cross-validation (Test and Score, Confusion Matrix), and external validation where the trained models are applied to an independent dataset (Predictions) to assess real-world diagnostic performance.
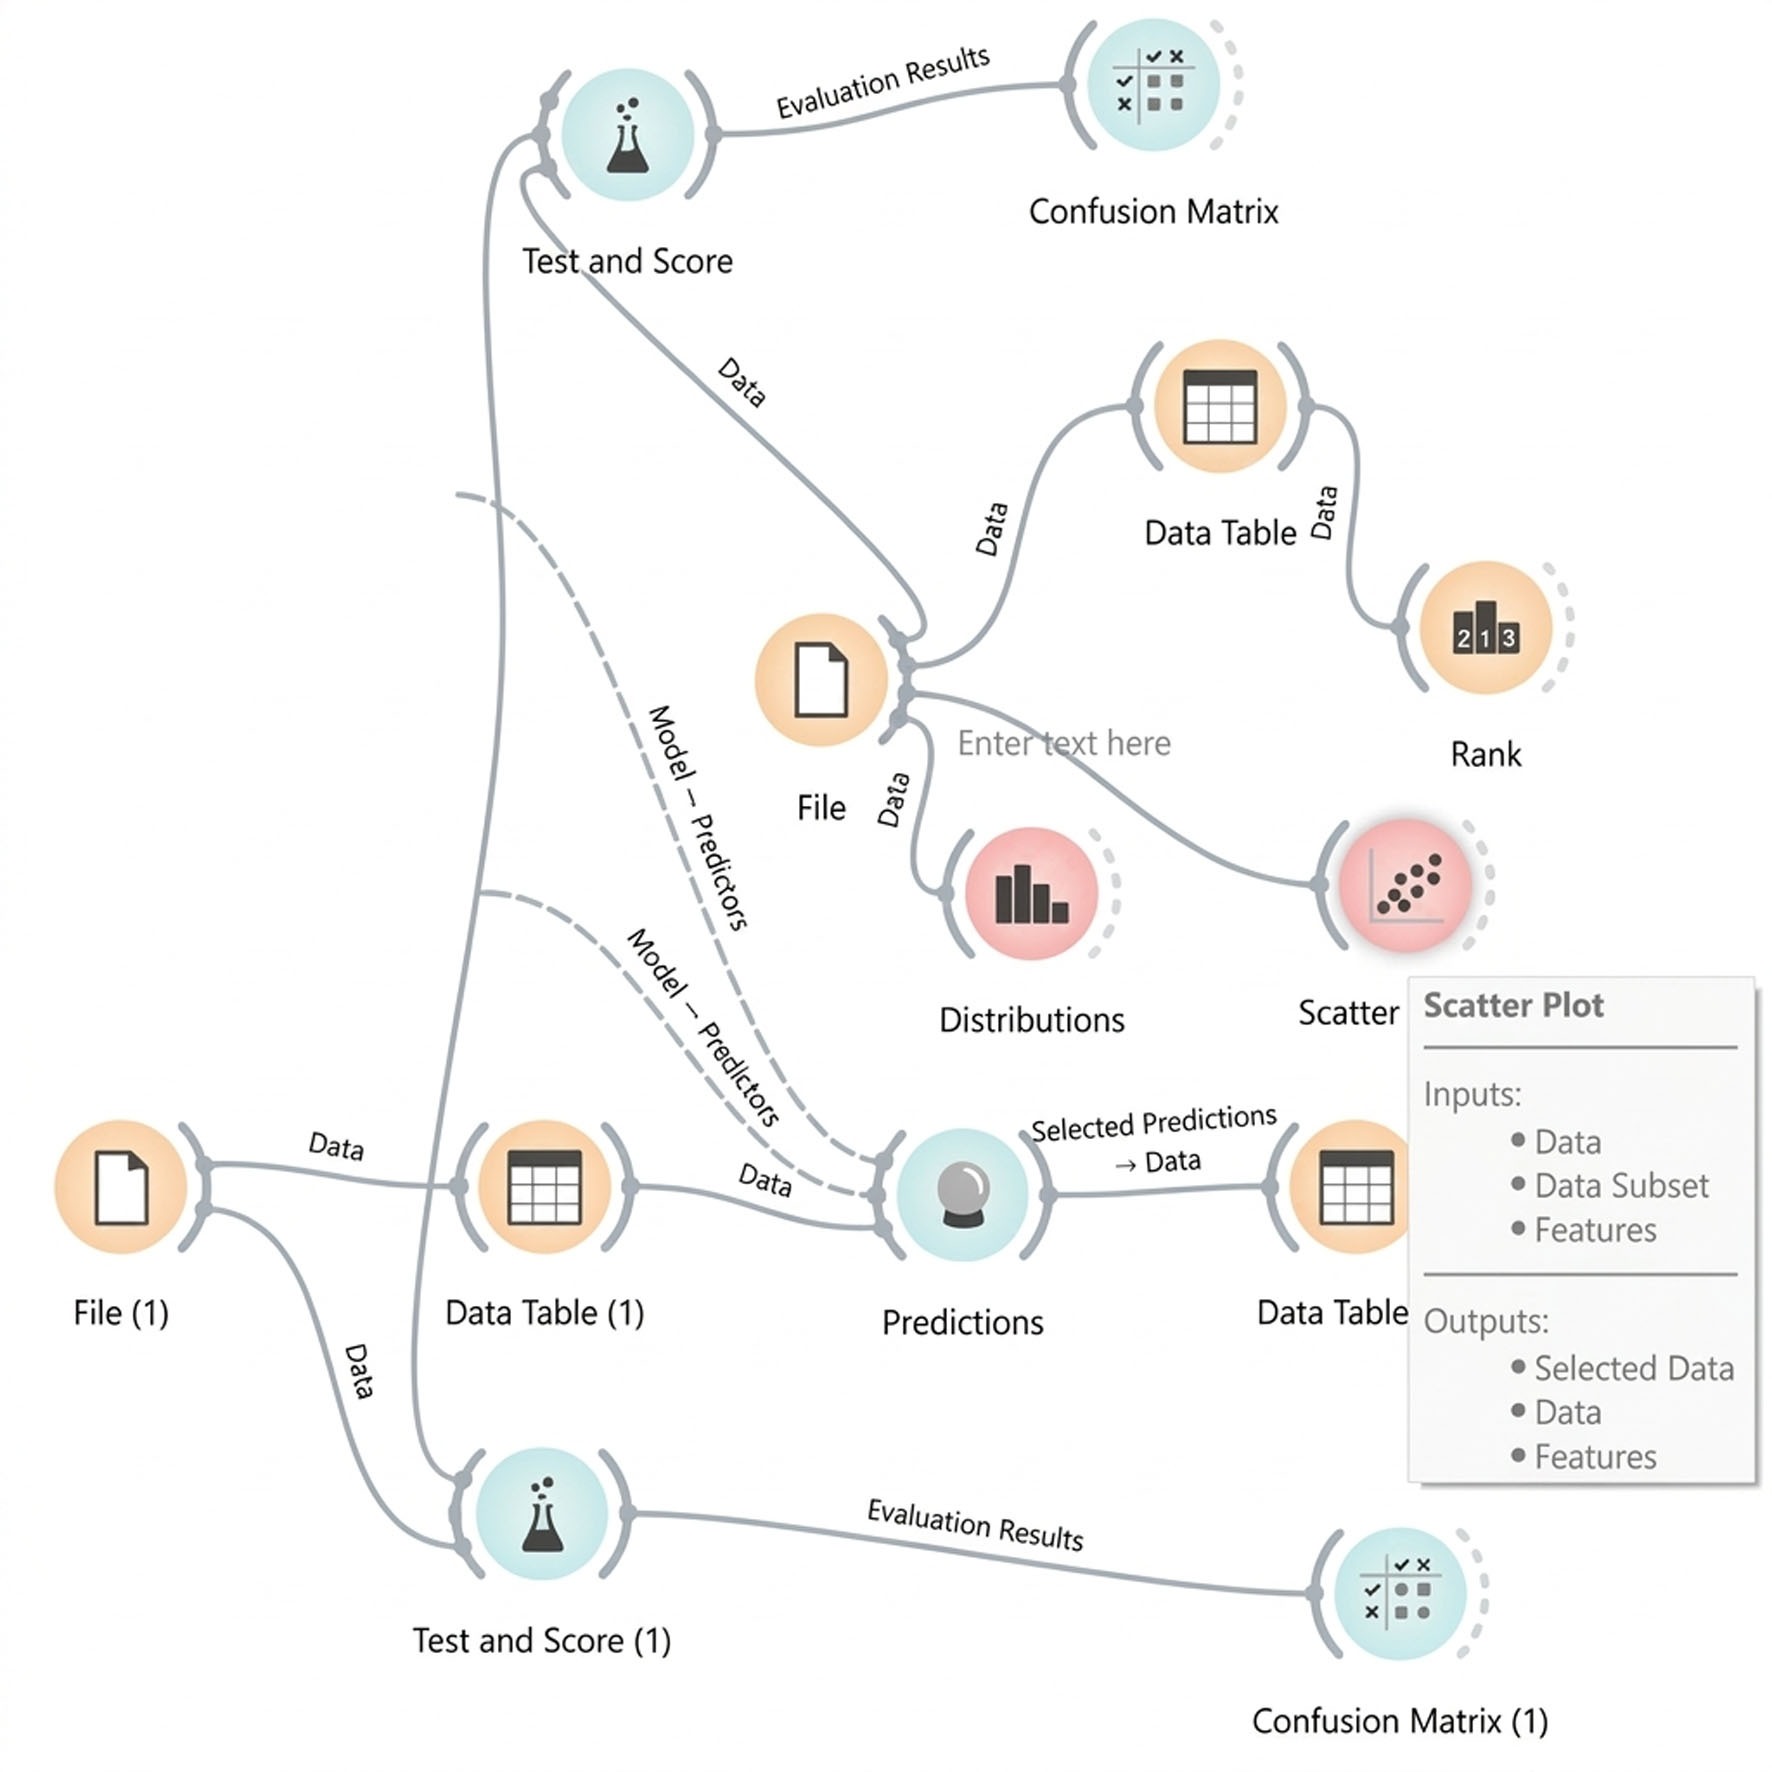
↓ Figure 2. Scatterplot showing clear distribution of hemoglobin cutoffs for reliability of data outcomes. Scatter plot illustrating the relationship between patient hemoglobin levels (x-axis) and the b diagnostic outcome. The distinct distribution of the data points visually confirms the model’s discriminative capability. This clear differentiation demonstrates that the algorithm successfully learned to isolate and distinguish low hemoglobin concentrations from normal or high values for accurate clinical classification.
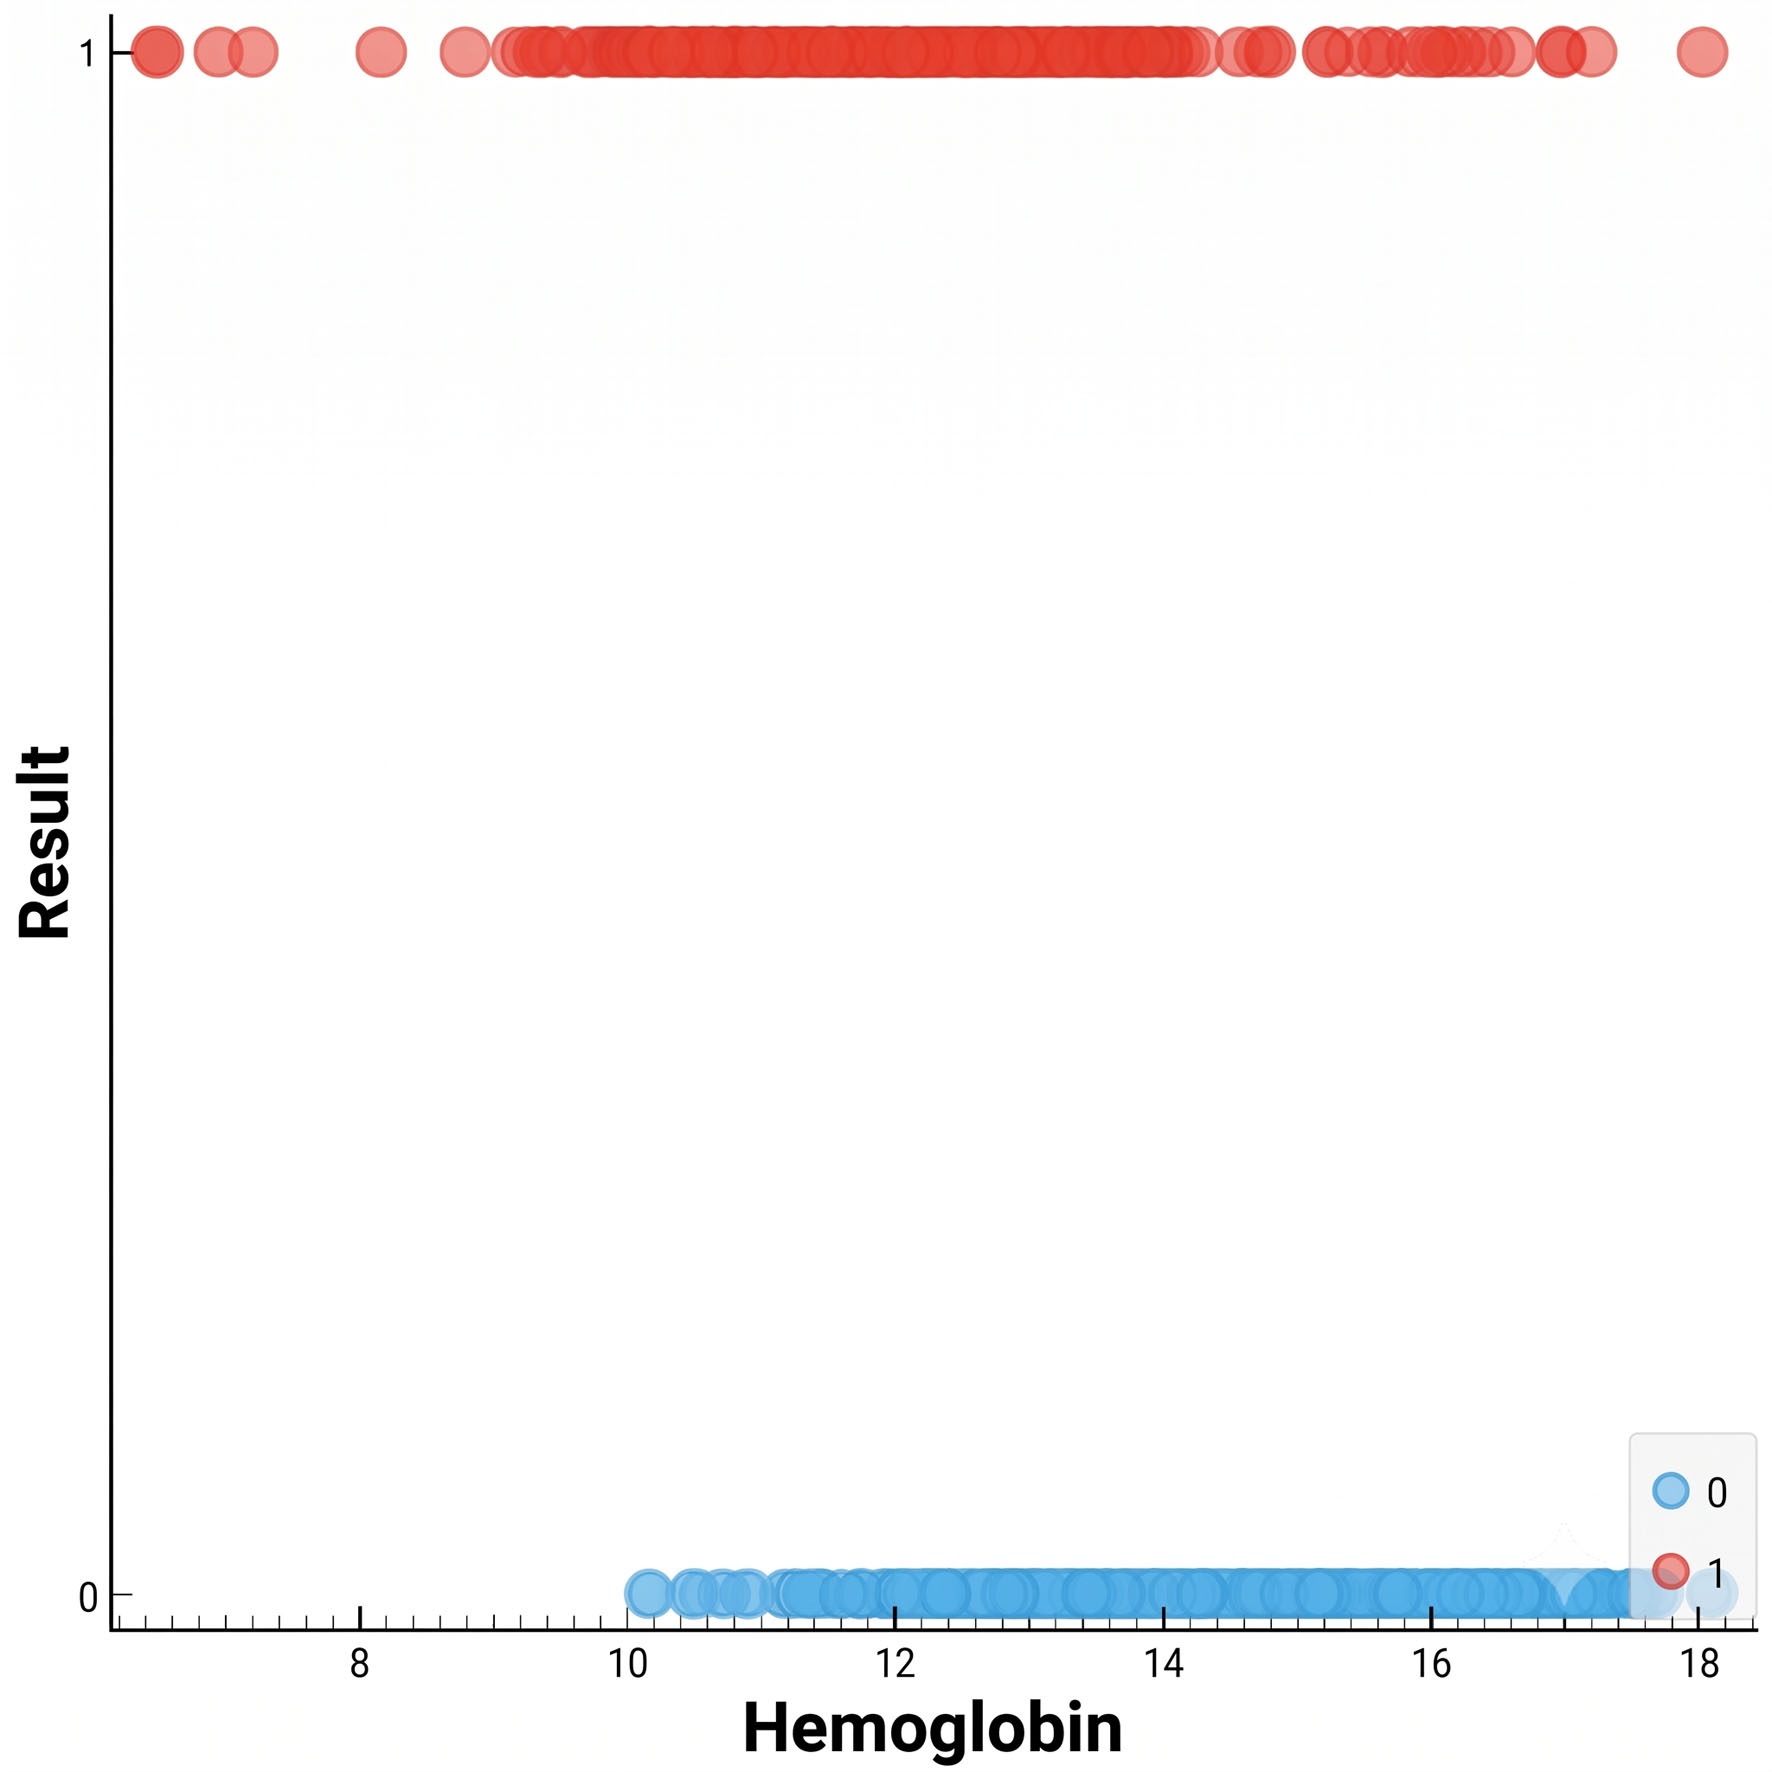
↓ Figure 3. Confusion matrices for decision tree versus logistic regression. The matrices visualize the predictive accuracy of the two evaluated algorithms on a dataset of 1,421 instances. Cells highlighted in blue represent correct classifications (true negatives and true positives), displaying the percentage of correctly predicted instances relative to the actual class total. Cells highlighted in red indicate misclassifications (false positives and false negatives).
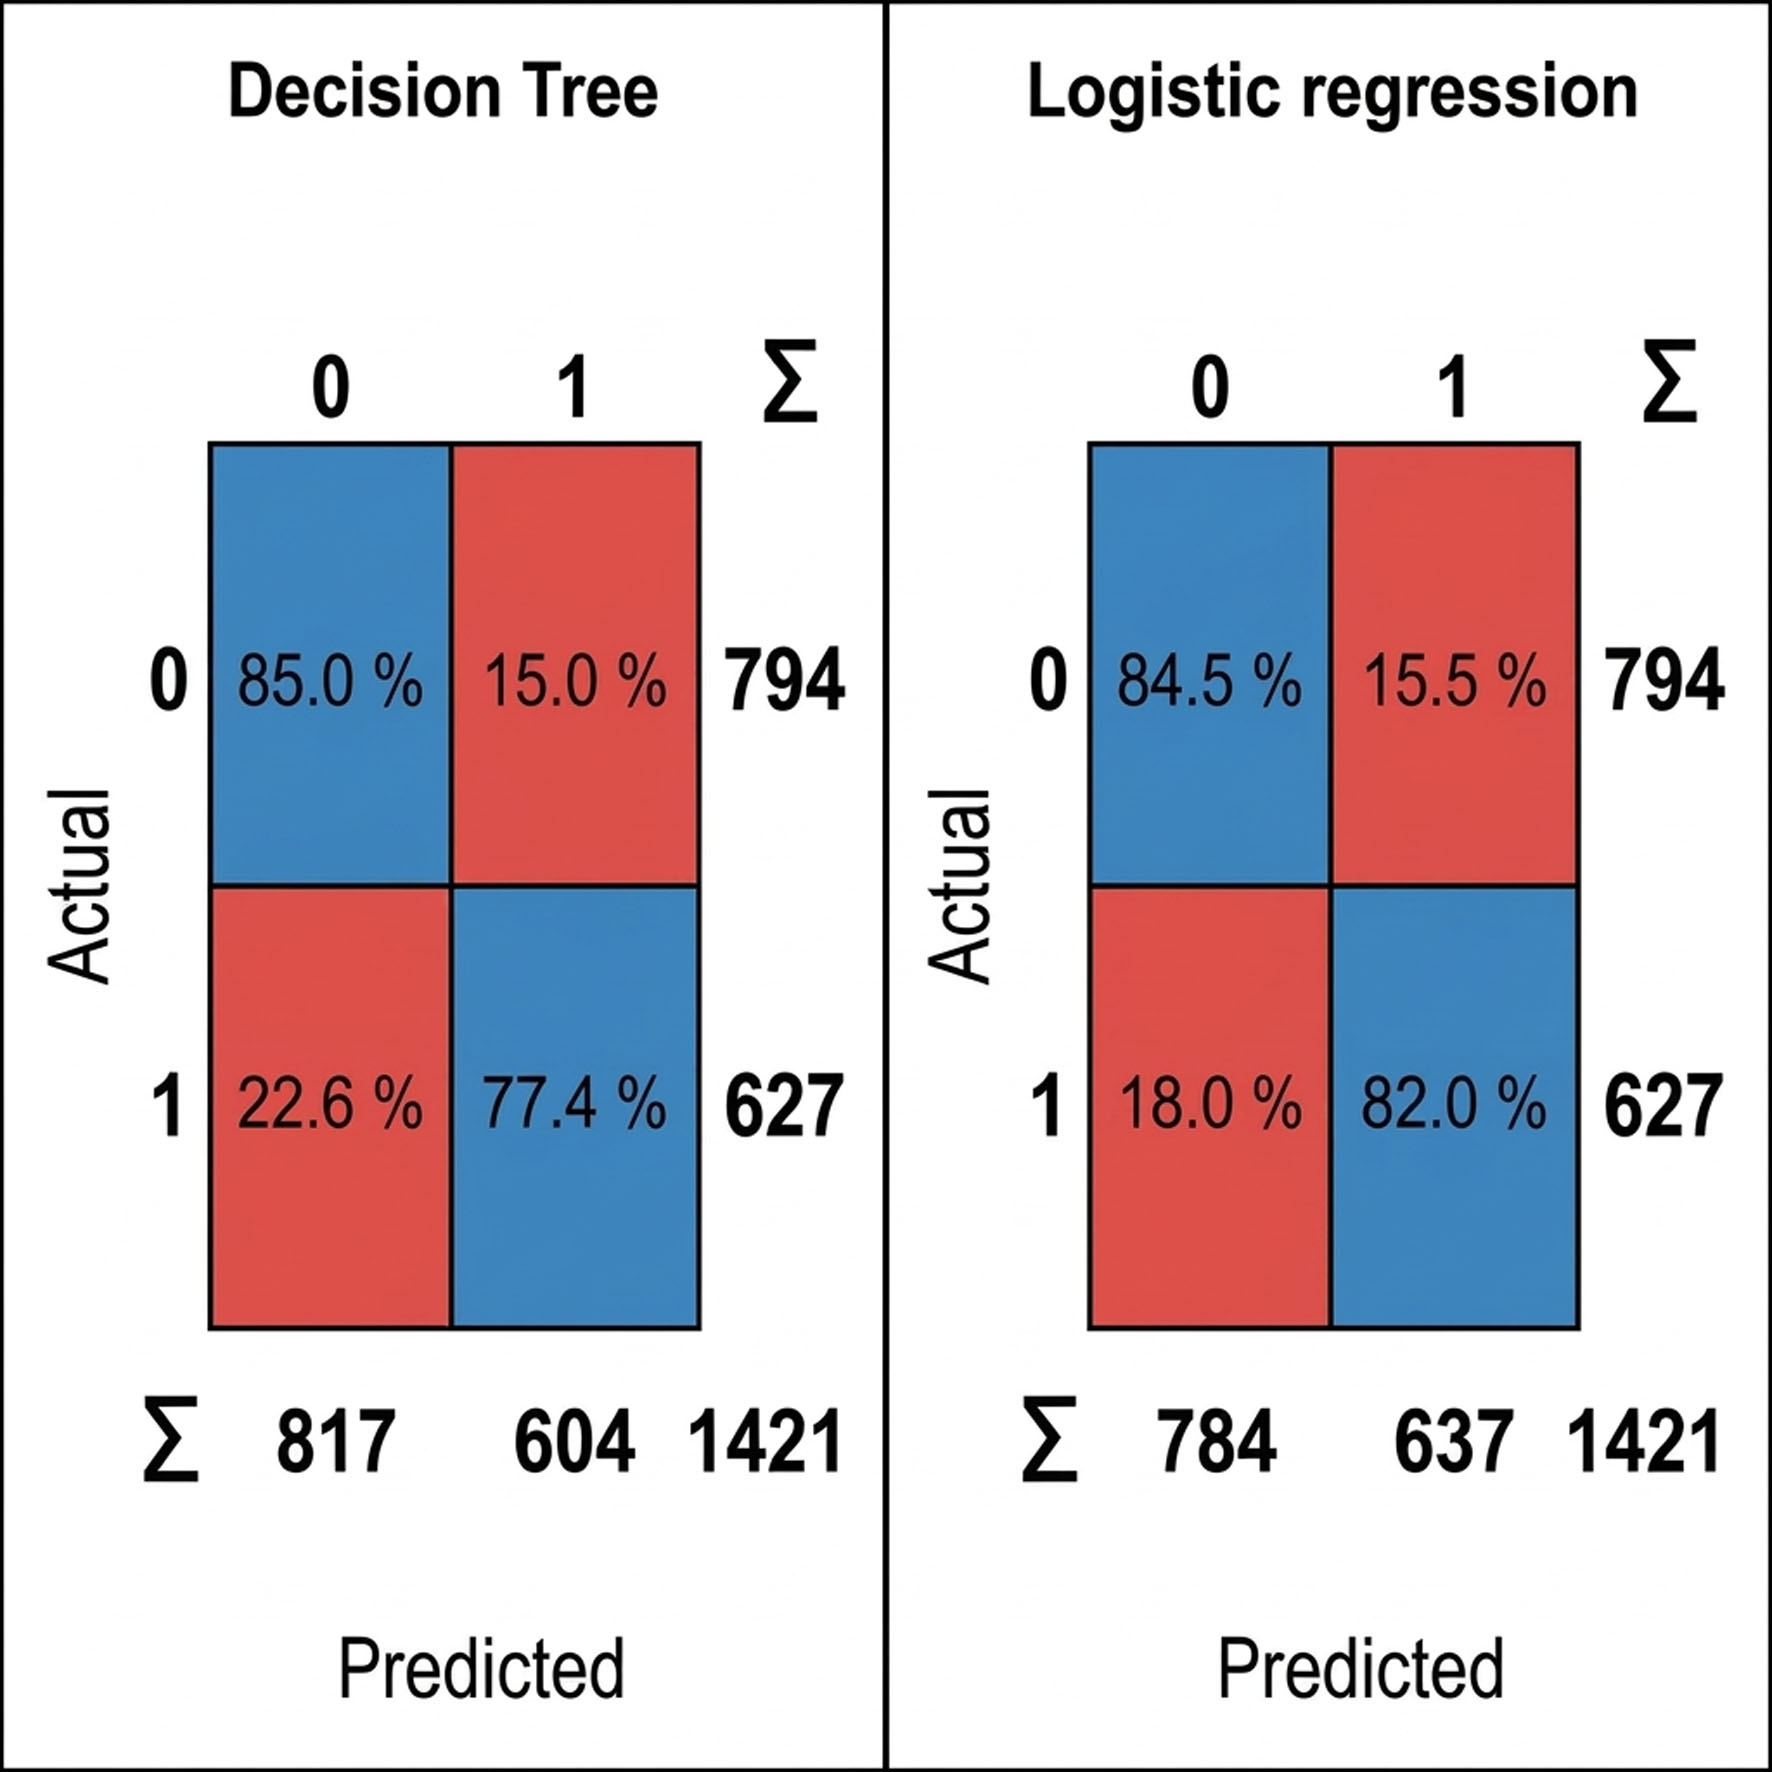
↓ Figure 4. Comparative performance analysis of logistic regression and decision tree classification models. This figure illustrates how reliably two different analytical tools categorize 364 test cases (350 actual instances of class 0, and 14 actual instances of class 1). The top table provides a performance report card, demonstrating that the logistic regression model achieved exceptionally high accuracy across all key reliability metrics (classification accuracy (CA) = 0.989, area under the curve = 0.997, and Matthews correlation coefficient (MCC) = 0.843). In contrast, while the decision tree showed high superficial accuracy (CA = 0.962) due to the dataset’s imbalance, it failed a critical overall performance measure (MCC = 0.000). The bottom grids map out the exact correct versus incorrect predictions. The logistic regression model successfully identified the vast majority of cases, whereas the decision tree model suffered a total classification failure by defaulting to the baseline category (class 0) for all 364 predictions, completely missing all 14 actual instances of the second category (class 1).