AI in Clinical Medicine, ISSN 2819-7437 online, Open Access
Article copyright, the authors; Journal compilation copyright, AI Clin Med and Elmer Press Inc
Journal website https://aicm.elmerpub.com

Original Article

Volume 2, January 2026, e38


Fidelity, Robustness, and Plausibility of Post-Hoc Explanations for Diabetic Retinopathy Grading: An Empirical Application of the Clinical-Explainable Artificial Intelligence Evaluation Framework

Figures

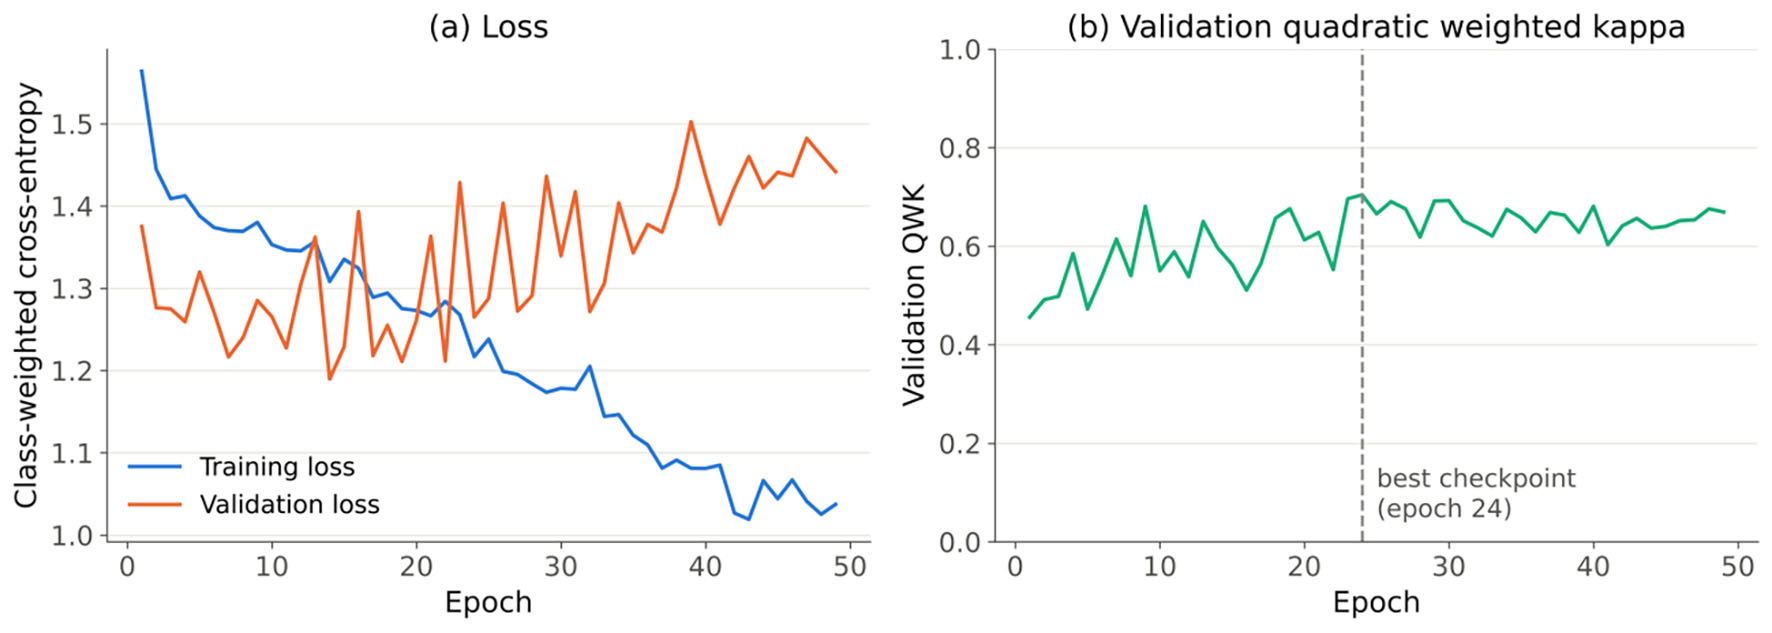
↓  Figure 1. Training curves for the primary compact CNN (seed 42) trained from scratch on RetinaMNIST. (a) Class-weighted cross-entropy loss on the training and validation sets. (b) Validation quadratic weighted kappa; the dashed line marks the retained checkpoint. CNN: convolutional neural network.
Figure 1.
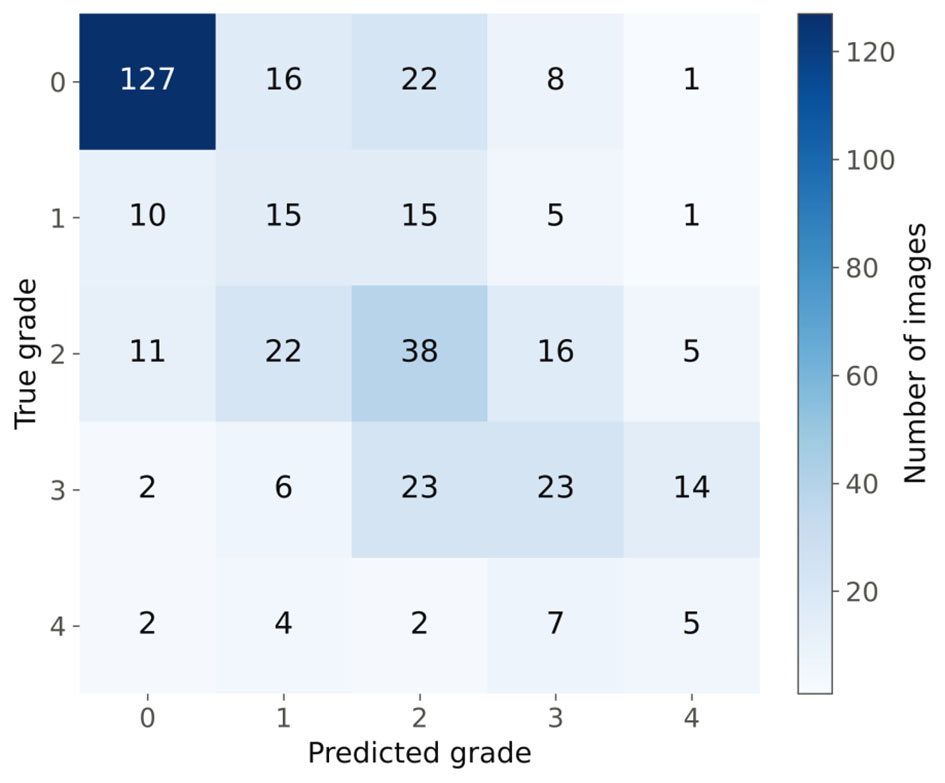
↓  Figure 2. Confusion matrix of the primary CNN (seed 42) on the 400-image RetinaMNIST test set for five-level diabetic retinopathy grading (0 = no retinopathy to 4 = proliferative retinopathy). CNN: convolutional neural network.
Figure 2.
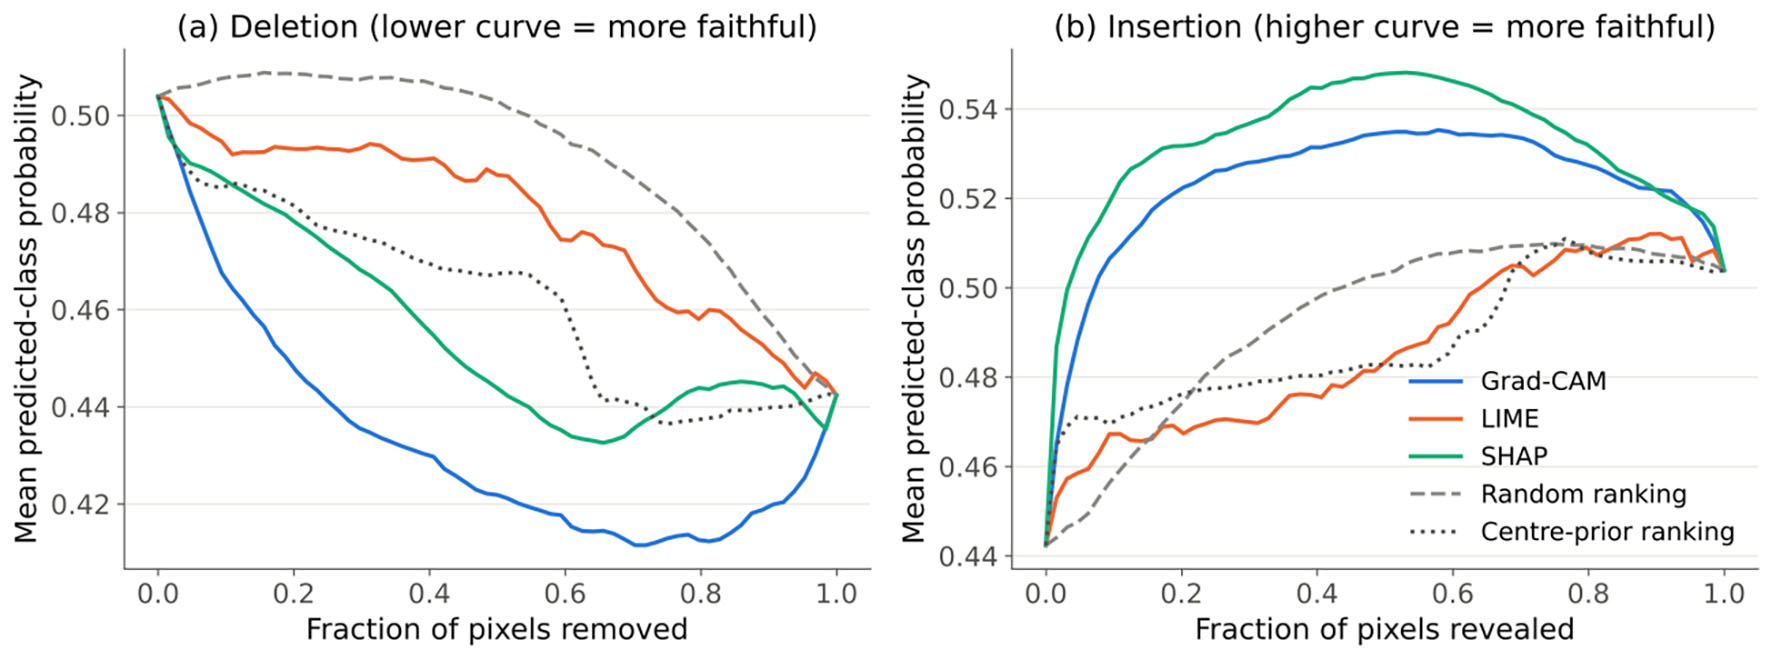
↓  Figure 3. Figure 3. Deletion (a) and insertion (b) curves for the primary CNN (seed 42), averaged over the 40 explained test images. The curves show the mean softmax probability of the target (predicted) class as pixels are progressively replaced by a blurred copy of the image (deletion) or restored from it (insertion), in the order given by Grad-CAM, LIME, or SHAP, or by the random and center-prior reference rankings. CNN: convolutional neural network; Grad-CAM: Gradient-weighted Class Activation Mapping; LIME: Local Interpretable Model-agnostic Explanations; SHAP: SHapley Additive exPlanations.
Figure 3.
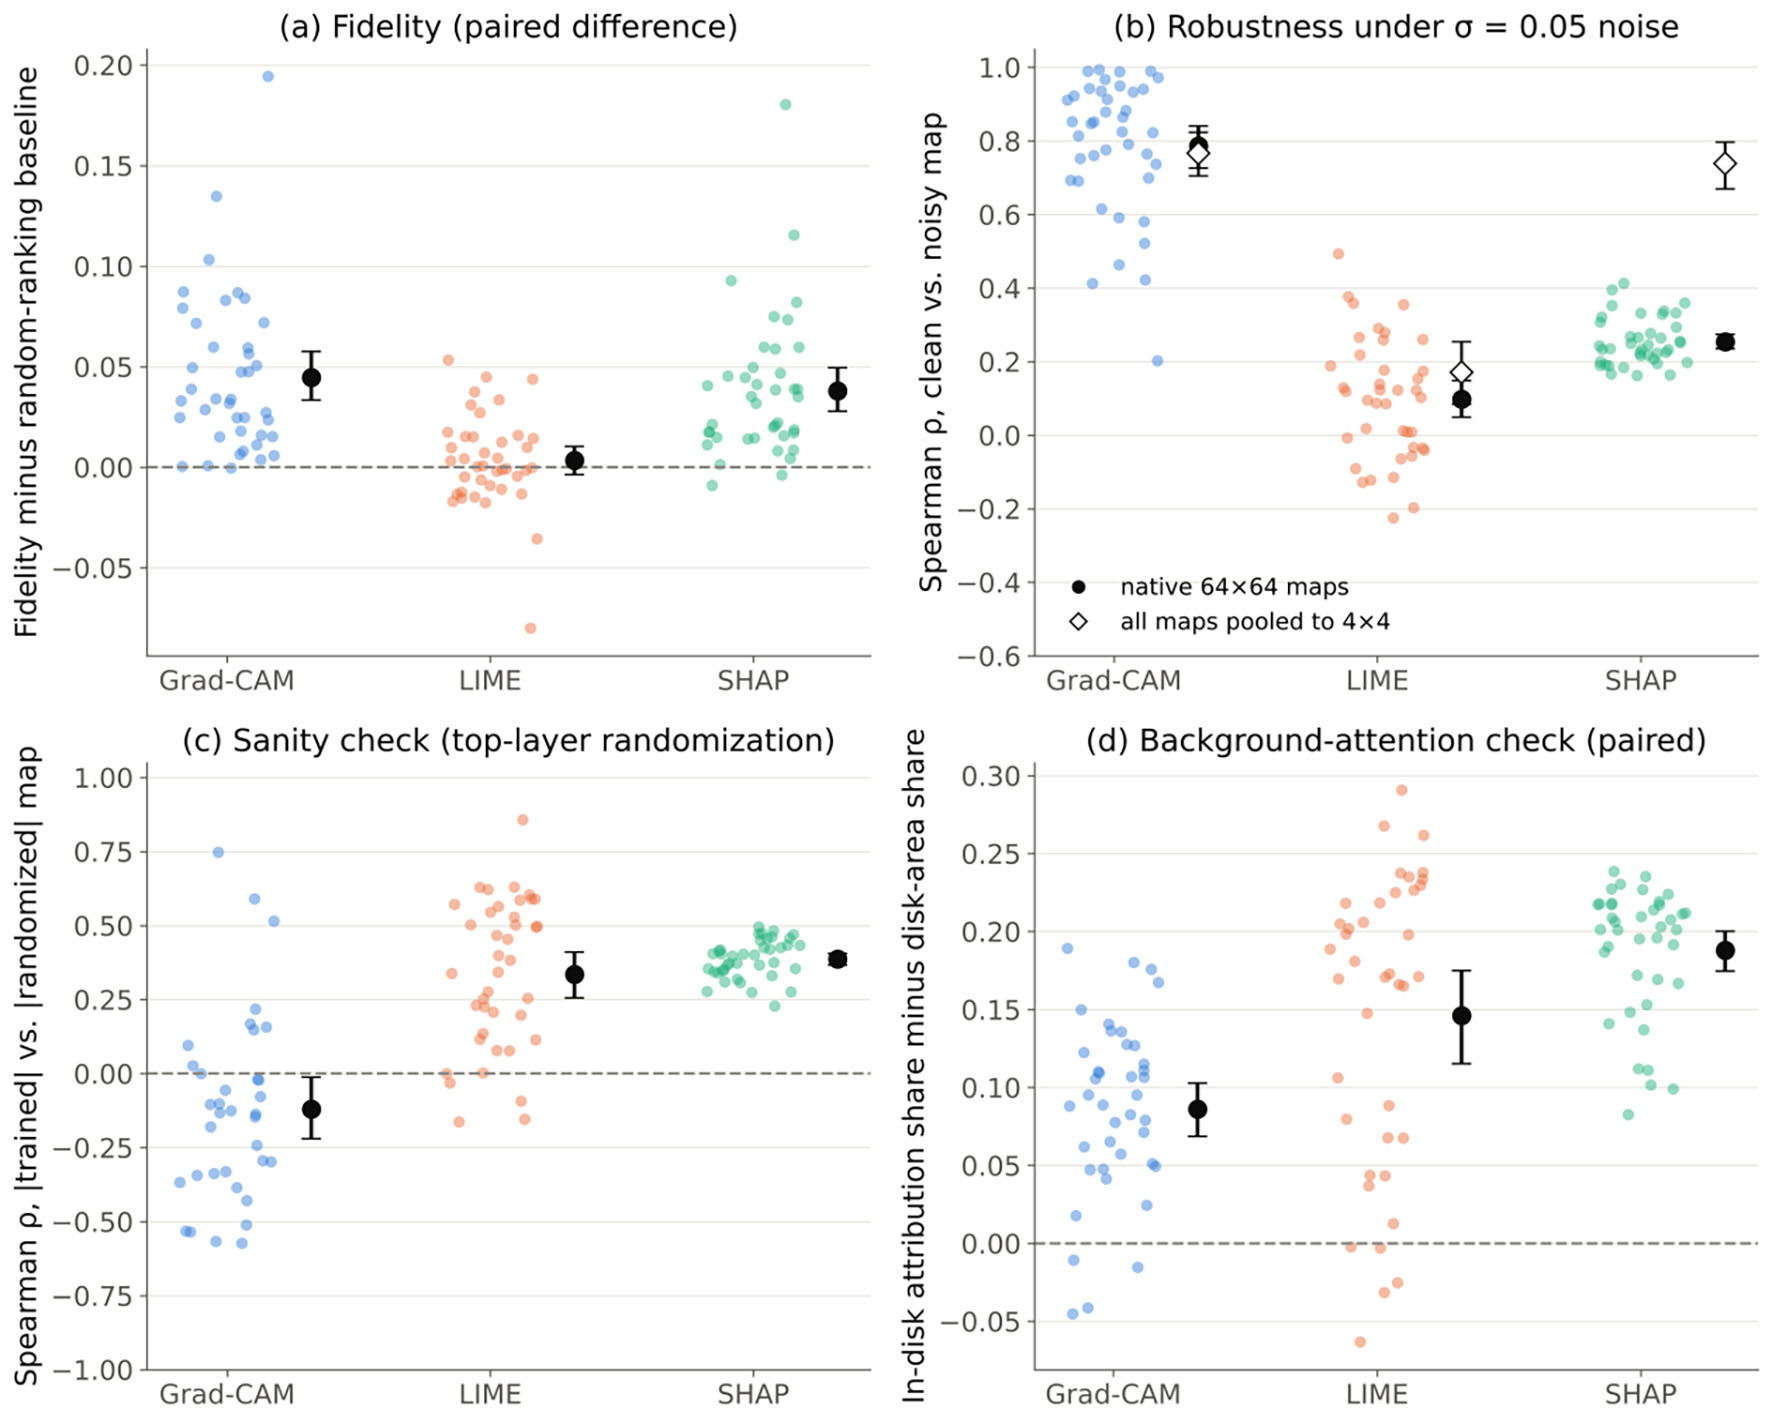
↓  Figure 4. Per-image explanation metrics for the primary CNN (seed 42; n = 40 images). Dots are individual images; black markers and bars are means with 95% bootstrap confidence intervals. (a) Combined deletion/insertion fidelity score minus the random-ranking score of the same image. (b) Spearman correlation between clean and noisy explanation maps (σ = 0.05), averaged over three noise realizations; open diamonds give the same statistic after pooling all maps to 4 × 4. (c) Spearman correlation between absolute-value maps from the trained model and from a model with re-initialized top layers; the five images for which the randomized Grad-CAM map was all zero are not shown. (d) Share of absolute attribution inside the fundus disk minus the disk’s share of the image area. Dashed lines mark zero difference. CNN: convolutional neural network; Grad-CAM: Gradient-weighted Class Activation Mapping; LIME: Local Interpretable Model-agnostic Explanations; SHAP: SHapley Additive exPlanations.
Figure 4.
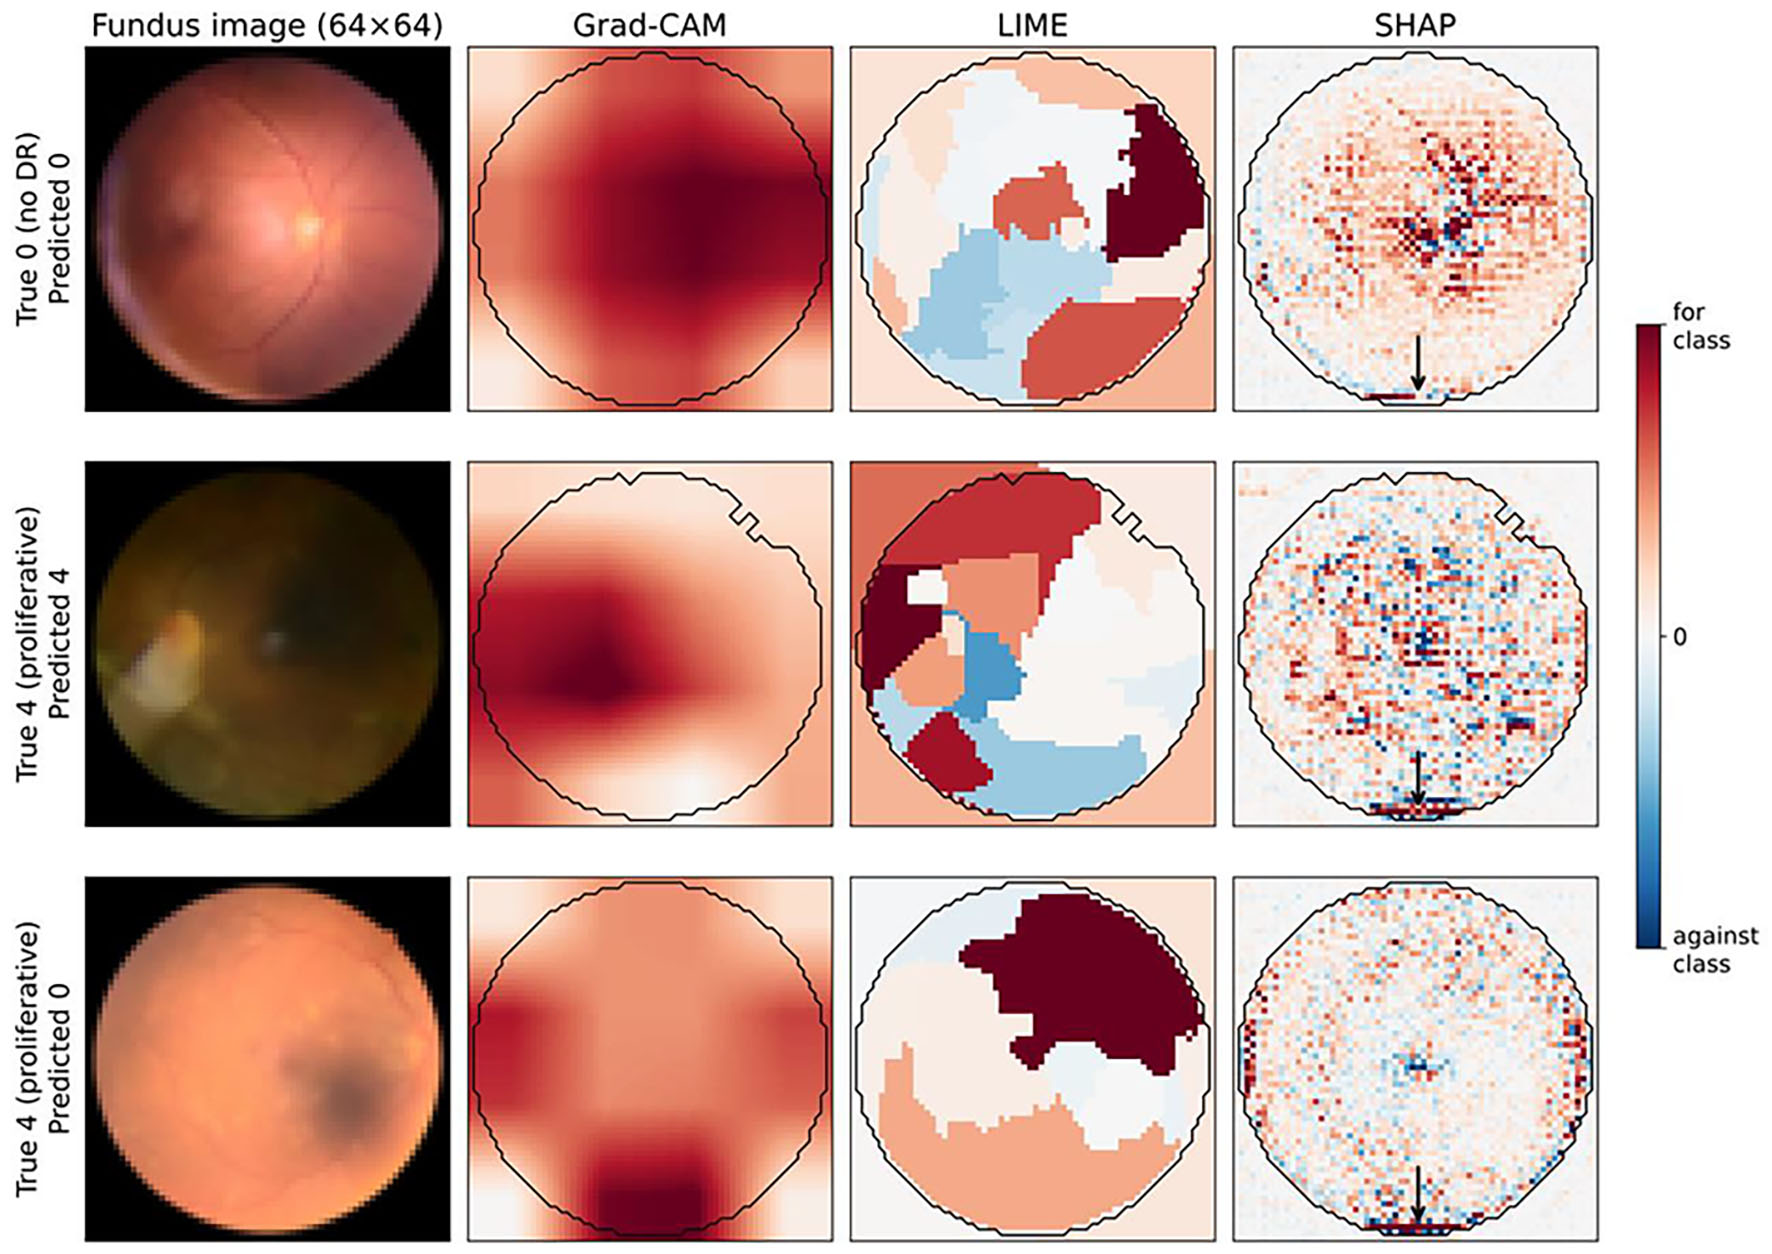
↓  Figure 5. Grad-CAM, LIME, and SHAP explanations from the primary CNN (seed 42) for three RetinaMNIST test images: a correctly classified Grade 0 image, a correctly classified Grade 4 image, and a Grade 4 image misclassified as Grade 0. Red indicates evidence for the predicted class and blue evidence against it; each map is scaled to its own 99th percentile of absolute attribution. The black contour is the automatically derived fundus-disk mask used in the background-attention check. Arrows mark SHAP attribution concentrated on the bright arc at the lower edge of the field of view, an image-acquisition artifact. Images are 64 × 64 pixels and contain no patient-identifying marks. CNN: convolutional neural network; Grad-CAM: Gradient-weighted Class Activation Mapping; LIME: Local Interpretable Model-agnostic Explanations; SHAP: SHapley Additive exPlanations.
Figure 5.

Tables

↓  Table 1. RetinaMNIST Dataset Composition by Split and Diabetic Retinopathy Severity Grade
 
SplitGrade 0Grade 1Grade 2Grade 3Grade 4Total
Training486128206194661,080
Validation541228206120
Test17446926820400


↓  Table 2. Classifier Architectures and Training Configuration
 
ParameterValue
CNN: convolutional neural network; LR: learning rate; QWK: quadratic weighted kappa; ReLU: rectified linear unit; ResNet: residual network.
Primary architecture4-block CNN (32→64→128→256 channels); each block 3 × 3 convolution, batch normalization, ReLU, 2 × 2 max pooling; 390,661 parameters
Input and normalization64 × 64 × 3; intensities scaled to 0–1; channel-wise standardization implemented as the first network layer
Pretrained weightsNone (trained from scratch)
Pooling/classifier headGlobal average pooling → dropout (P = 0.4) → linear (256→5)
Loss functionClass-weighted cross-entropy (weights inversely proportional to class frequency)
OptimizerAdam (initial LR 10−3, weight decay 10−4); batch size 64
LR scheduleReduceLROnPlateau (factor 0.5, patience 8 epochs, monitored on validation loss)
Data augmentationHorizontal flip (P = 0.5); rotation by 90°, 180°, or 270° (P = 0.3)
Max epochs/early stopping150 max; patience 25 epochs on validation QWK
Random seeds42 (primary); 7, 123, 2024, and 31337 (replicates)
Epochs actually trained49 for seed 42 (best checkpoint at epoch 24); 48–64 across the five seeds
Comparator architectureResNet-18 trained from scratch; first convolution 3 × 3 with stride 2, no initial max pooling (4 × 4 final feature map); 11.2 million parameters; seeds 42, 7, and 123; identical training procedure; 33–46 epochs trained


↓  Table 3. Explanation-Method Settings, Evaluation Protocol, and Software Versions
 
ItemSetting
AUC: area under the curve; CI: confidence interval; CNN: convolutional neural network; CPUs: central processing units; Grad-CAM: Gradient-weighted Class Activation Mapping; LIME: Local Interpretable Model-agnostic Explanations; ReLU: rectified linear unit; ResNet: residual network; SHAP: SHapley Additive exPlanations.
Grad-CAMCaptum LayerGradCam on the output of the final convolutional block (CNN: block 4, 4 × 4 × 256; ResNet-18: layer 4, 4 × 4 × 512); ReLU applied to the weighted activation map; bilinear upsampling to 64 × 64. Resolution ablation: penultimate block (8 × 8).
LIMElime_image LimeImageExplainer; quickshift segmentation (kernel size 2, maximum distance 6, ratio 0.5, seed 0; median 28 superpixels); hidden superpixels replaced by their mean color; 1,000 perturbation samples; explainer seed 0 (seed 1 for the explainer-seed floor); pixel value = surrogate weight of its superpixel for the target class.
SHAPGradientExplainer (expected gradients); fixed background of 32 training images; 200 samples; seed 0 (seed 1 for the explainer-seed floor); attributions summed over color channels.
Explained classClass predicted for the clean image; held fixed for noisy-input and randomized-model explanations.
Images40 test images (eight per true grade) selected at random with a fixed seed; identical for all methods, models, and seeds.
Input perturbationAdditive Gaussian noise, σ = 0.05 on the 0–1 scale, per pixel and channel, clipped to [0, 1]; three fixed realizations per image, identical for all methods, models, and seeds.
Deletion/insertion64 steps of 64 pixels; replacement image = Gaussian blur (σ = 4 pixels) of the same image; target-class softmax probability; trapezoidal AUC over the fraction of pixels (0–1). Reference rankings: random (mean of 3) and center-prior.
Sanity checkRe-initialization of (a) the final convolutional block and classification layer, or (b) all layers; Spearman correlation of absolute-value maps.
Background-attention maskChannel-mean intensity > 15/255; morphological opening (3 × 3, one iteration); hole filling.
StatisticsImage as unit; 95% percentile bootstrap CIs (5,000 resamples); two-sided Wilcoxon signed-rank tests with Holm adjustment within each family of three tests.
SoftwarePython 3.13.16; PyTorch 2.14.1; torchvision 0.29.1; Captum 0.9.0; LIME 0.2.0.1; SHAP 0.53.0; scikit-image 0.26.0; scikit-learn 1.9.1; SciPy 1.18.1; NumPy 2.5.3. All computation on CPUs.


↓  Table 4. Coverage of the Six Clinical-XAI Evaluation Framework Dimensions in This Study
 
DimensionTested in this study?Protocol used/reason not tested
AUC: area under the curve; XAI: explainable artificial intelligence.
1. FidelityYesDeletion/insertion AUC compared with random and center-prior rankings; model-randomization sanity check for all three methods
2. RobustnessYesSpearman stability under Gaussian noise (σ = 0.05; three matched realizations) at native and 4 × 4-pooled resolution
3. PlausibilityPartially (background-attention check only)Share of attribution inside the fundus disk compared with the disk-area share; does not assess lesion localization, which requires lesion annotations or a reader study
4. ActionabilityNoRequires measuring change in clinician behavior or patient outcome under real/simulated deployment
5. EquityNoRetinaMNIST provides no demographic or device subgroup metadata (e.g., sex, age, ethnicity, imaging device)
6. Regulatory readinessNoRequires assessment against a specific jurisdiction’s documentation and oversight requirements; outside the scope of this technical analysis


↓  Table 5. Per-Class Precision, Recall, and F1-Score for the Primary Classifier (CNN, Seed 42) on the 400-Image RetinaMNIST Test Set
 
Severity gradePrecisionRecallF1-scoreSupport (n)
CNN: convolutional neural network; DR: diabetic retinopathy.
Grade 0 (no DR)0.8360.7300.779174
Grade 1 (mild)0.2380.3260.27546
Grade 2 (moderate)0.3800.4130.39692
Grade 3 (severe)0.3900.3380.36268
Grade 4 (proliferative)0.1920.2500.21720
Macro average0.4070.4110.406400
Weighted average0.5540.5200.534400


↓  Table 6. Fidelity, Sanity-Check, Robustness, and Background-Attention Results for the Primary Model, by Explanation Method
 
Dimension/metricGrad-CAMLIMESHAP
Values are means with 95% bootstrap confidence intervals over n = 40 images (primary CNN, seed 42) unless stated; P values are Holm-adjusted Wilcoxon signed-rank tests. Reference rankings: random 0.500 (0.499, 0.501), center-prior 0.513 (0.499, 0.527) (combined fidelity score). Penultimate-layer (8 × 8) Grad-CAM: fidelity 0.556 (0.543, 0.572), robustness (native) 0.687 (0.608, 0.760), pooled 0.701 (0.612, 0.779). Sanity-check n < 40 for Grad-CAM because randomized models produced all-zero maps for the remaining images. Mean disk-area share 0.700. AUC: area under the curve; CNN: convolutional neural network; Grad-CAM: Gradient-weighted Class Activation Mapping; LIME: Local Interpretable Model-agnostic Explanations; SHAP: SHapley Additive exPlanations; ρ: Spearman rank correlation.
Fidelity: combined deletion/insertion score0.545 (0.534, 0.558)0.504 (0.497, 0.510)0.538 (0.528, 0.550)
Fidelity: deletion AUC (lower = better)0.433 (0.374, 0.496)0.479 (0.415, 0.544)0.456 (0.392, 0.523)
Fidelity: insertion AUC (higher = better)0.523 (0.458, 0.590)0.486 (0.421, 0.554)0.532 (0.466, 0.600)
Fidelity minus random ranking (paired)0.045 (0.033, 0.058)
P < 0.001
0.003 (−0.004, 0.010)
P = 0.36
0.038 (0.028, 0.050)
P < 0.001
Fidelity minus center-prior ranking (paired)0.032 (0.020, 0.045)−0.009 (−0.027, 0.007)0.025 (0.008, 0.043)
Sanity check: ρ, trained vs. top-randomized model−0.120 (−0.221, −0.013)
(n = 35)
0.335 (0.255, 0.411)0.386 (0.366, 0.406)
Sanity check: ρ, trained vs. fully randomized model0.269 (0.140, 0.386)
(n = 22)
0.357 (0.271, 0.437)0.311 (0.291, 0.331)
Explainer-seed floor: ρ, two seeds, clean image1 (deterministic)0.991 (0.986, 0.994)0.935 (0.928, 0.941)
Robustness: ρ, clean vs. noisy, native 64 × 640.786 (0.726, 0.840)0.097 (0.048, 0.149)0.254 (0.235, 0.274)
Robustness: ρ, clean vs. noisy, pooled to 4 × 40.767 (0.704, 0.823)0.171 (0.084, 0.254)0.739 (0.670, 0.797)
Robustness (native), prediction unchanged (n = 18)0.871 (0.812, 0.924)0.092 (−0.001, 0.185)0.296 (0.266, 0.326)
Robustness (native), prediction changed (n = 22)0.716 (0.629, 0.797)0.102 (0.048, 0.156)0.219 (0.205, 0.235)
Background attention: share of attribution in fundus disk0.786 (0.764, 0.806)0.846 (0.815, 0.874)0.888 (0.865, 0.909)
Background attention: in-disk share minus disk-area share (paired)0.086 (0.069, 0.103)
P < 0.001
0.146 (0.115, 0.175)
P < 0.001
0.188 (0.174, 0.200)
P < 0.001
Images with positive paired difference (of 40)363540


↓  Table 7. Consistency of Explanation Metrics Across Training Seeds and Architectures
 
MetricModelGrad-CAMLIMESHAP
CNN values are the mean ± standard deviation, across the five seeds (42, 7, 123, 2024, 31337), of each model’s 40-image mean; each model was evaluated on the same 40 images with the same noise realizations. CNN: convolutional neural network; ResNet: residual network; SD: standard deviation; ρ: Spearman rank correlation; AUC: area under the curve; CNN: convolutional neural network; Grad-CAM: Gradient-weighted Class Activation Mapping; LIME: Local Interpretable Model-agnostic Explanations; SHAP: SHapley Additive exPlanations; ρ: Spearman rank correlation.
Fidelity: combined scoreCNN, 2 seeds (mean ± SD)0.543 ± 0.0030.502 ± 0.0030.536 ± 0.003
Fidelity minus random rankingCNN, 2 seeds (mean ± SD)0.043 ± 0.0020.002 ± 0.0020.036 ± 0.002
Sanity check: ρ vs. top-randomized modelCNN, 2 seeds (mean ± SD)−0.097 ± 0.0330.355 ± 0.0280.393 ± 0.010
Robustness: ρ, native resolutionCNN, 2 seeds (mean ± SD)0.725 ± 0.0870.043 ± 0.0760.254 ± 0.000
Robustness: ρ, pooled to 4 × 4CNN, 2 seeds (mean ± SD)0.704 ± 0.0880.088 ± 0.1170.707 ± 0.045
In-disk share minus disk-area shareCNN, 2 seeds (mean ± SD)0.087 ± 0.0010.129 ± 0.0240.190 ± 0.003