| AI in Clinical Medicine, ISSN 0000-0000 online, Open Access |
| Article copyright, the authors; Journal compilation copyright, AI Clin Med and Elmer Press Inc |
| Journal website https://aicm.elmerpub.com |
Original Article
Volume 1, 2025, e10

Correlations Between Wald Chi-Squared Values and Standardized Beta-Coefficients in Regression Analysis and Feature Importance Calculated Using Machine Learning
Kei Nakajimaa, b, c ![]() , Airi Sekinea
, Airi Sekinea ![]()
aDepartment of Nutritional Science, Faculty of Food and Nutritional Sciences, Japan Women’s University, Bunkyo-ku, Tokyo 112-8681, Japan
bSaitama Medical Center, Department of Endocrinology and Diabetes, Saitama Medical University, Kawagoe 350-8550, Japan
cCorresponding Author: Kei Nakajima, Department of Nutritional Science, Faculty of Food and Nutritional Sciences, Japan Women’s University, Bunkyo-ku, Tokyo 112-8681, Japan
Manuscript submitted September 20, 2025, accepted September 26, 2025, published online October 8, 2025
Short title: Regression Beta vs. ML Feature Importance
doi: https://doi.org/10.14740/aicm10
| Abstract | ▴Top |
Background: Standardized β-coefficients (stBs) are traditional indices that enable the estimation of covariates that more strongly influence outcomes. However, in studies possessing many categorical covariates, stBs are often difficult to calculate. In contrast, Wald Chi-squared (WCS) values, calculated in logistic regression analysis, represent the magnitude of a covariate’s statistical significance. To date, many machine-learning algorithms have been used to evaluate the feature importance (FI), which is used to predict the order of precedence of covariates’ contributions to outcomes. Therefore, the relationships between WCS values and both stBs and FI were investigated using several existing clinical databases.
Methods: We investigated the correlations between WCS values and both stBs in logistic regression analysis and FI calculated using machine learning and the data from 615,077 and 90,053 middle-aged people in our previous studies (including one study that used a generalized linear model) and two studies using open data obtained from 86,151 medical students and 100,000 children. The covariates were standardized, and StBs were obtained using logistic regression analysis.
Results: Overall, WCS values were more highly correlated with FI (Spearman correlation, ρ = 0.79 - 0.94) than with stBs (ρ = 0.73 - 0.85) and were very highly correlated with stBs (ρ = 0.83 - 0.99) in five studies.
Conclusions: These results suggest that WCS values likely represent covariates’ statistical significances and the magnitudes of covariates’ influences on outcomes, which is consistent with the very high correlation between WCSs and stBs. However, because these results were obtained using limited data, they must be verified through further study.
Keywords: Wald Chi-squared value; β-coefficient; Standardized β-coefficient; Feature importance; Machine learning; Logistic regression; Generalized linear model; Contribution
| Introduction | ▴Top |
In logistic regression analysis, generalized linear models (GLMs), and Cox hazard regression analysis, common ratio indices, such as odds ratios, relative risks, and hazard ratios, are provided for explanatory variables. However, these indices represent neither the degrees to which explanatory variables contribute to outcomes nor the order of precedence of the magnitudes of explanatory variables’ contributions to outcomes in models. Instead, odds or risk ratios exclusively represent the effects of explanatory variables on outcomes relative to each reference or the effects of an increase of one unit of continuous variables on outcomes, respectively [1, 2].
In clinical studies, although the investigation of such ratios is important for specific explanatory variables, knowledge of the order of precedence among the variables and their contributions to the overall outcome is also crucial because the outcomes of common chronic diseases are explained by different degrees of many factors.
To date, however, many investigators often focus on a specific factor even though data are available for other outcome-related factors, usually considered as covariates, mostly confounding factors in multivariable regression models. In this context, it may be important to know whether the factor of interest contributes to outcomes more strongly than the other factors, for example, age, sex, and body mass index (BMI), common comorbidities, such as hypertension, diabetes, and dyslipidemia, instead of just confirming the odds or risk ratios of the factor of interest in clinical studies.
Although unstandardized β-coefficients are calculated based on the natural logarithms of odds and risk ratios, β-coefficients mostly depend on the scale at which variables are measured [3-5]. Therefore, β-coefficients are not used to directly compare the influences of covariates on outcomes.
Traditionally, standardized β-coefficients (stBs), unitless indices, have been used to compare the degrees of covariates’ contributions to outcomes. In other words, high absolute values of stBs, but not unstandardized β-coefficients, represent a large influence on the outcome (dependent variable). However, stBs are often difficult to calculate in analysis models possessing many covariates, particularly unordered categories [6, 7].
Meanwhile, for evaluating explanatory variables, many machine-learning algorithms, such as XGboost and random forest, provide the feature importance (FI) in the results [8-10]. Among many potential factors, FI enables the selection of the factors contributing more strongly to explaining outcomes [11, 12]. Although stBs and FI seem to contribute similarly to outcomes, to the best of our knowledge, the relationship between them has not been investigated yet using clinical data.
In contrast, although Wald Chi-squared (WCS) values, traditional indices calculated in logistic regression analysis, represent the magnitudes of covariates’ statistical significances [13, 14], to the best of our knowledge, WCS values’ usefulness has not been fully elucidated, and the relationships between WCS values and both stBs and FI have not been investigated yet.
Therefore, we investigated the correlations between WCS values and both stBs in logistic regression analysis and FI calculated using machine learning and the data from our two previous studies and two open databases.
| Materials and Methods | ▴Top |
Design
In three studies, we investigated the linear and rank correlations between WCS values and both stBs in logistic regression analysis and FI calculated using machine learning and the data from our two previous studies using a national database [15, 16] comprising data on 615,077 (including one study that used a GLM) [17] and 90,053 middle-aged people (from 40 to 70 years old) [18] who had undergone a health checkup. Since 2008, all Japanese people aged 40 - 74 years have been required to undergo a yearly itemized health checkup managed by Japan’s Ministry of Health, Labour, and Welfare (MHLW) [19]. After the MHLW rigorously reviewed our research project, our protocol for the national database (NDB) study was accepted in December 2020. We received digitally recorded anonymized data from the MHLW in July 2022. The study was conducted according to the guidelines of the Declaration of Helsinki and was approved by the Institutional Review Board of the Ethics Committee of Japan Women’s University (No. 513) and the MHLW of Japan (No. 1320). Informed consent was not required because anonymized data were obtained from the MHLW of Japan, as a part of its nationwide program involving the provision of medical data to third parties. The study protocol is available online [20]. This study included data on individuals living in the seven Kanto prefectures, who had undergone specific health checkups and were neither hospitalized nor nursing home residents at the time of the checkup. To protect individual privacy and identities, as instructed by the MHLW, the individuals’ ages were categorized as 40 - 44, 45 - 49, 50 - 54, 55 - 59, and 60 - 64 years.
Two other studies were conducted using open data on 86,151 medical students [21] and 100,000 children [22], which are freely downloadable online.
Statistical indices
In logistic regression analysis and GLMs, WCS values are calculated using the following equation:
In linear regression analysis, stBs are calculated using following equation:
Theoretically, stBs express the average change in the standard deviations of an outcome variable associated with a one-standard-deviation change in a predictor variable [3, 5].
In this study, WCS values were obtained for the logistic regression analysis and GLM, while stBs were obtained for standardized covariates, instead of using Equation (2), is applicable to linear regression analysis but not logit analysis. We evaluated the FI for predictions using commercially available machine-learning software.
Studies for data analysis
We reanalyzed the existing data from our previous studies and open data.
Study 1 investigated the clinical contributors to a 10% increase in bodyweight over 10 years (outcome) in middle-aged individuals (aged 40 - 64 years) possessing a normal bodyweight (body mass index (BMI) = 21.0 - 24.9 kg/m2) at the baseline (n = 615,077, area under the curve (AUC) 68.5%), as analyzed using a logistic regression model possessing 14 explanatory factors, including age; sex; BMI; systolic blood pressure; serum triglyceride (TG), high-density lipoprotein cholesterol (HDL-C), and glycated hemoglobin (HbA1c) levels; self-reported pharmacotherapy (for hypertension, diabetes, and dyslipidemia); engagement in regular exercise; smoking status; frequency of alcohol drinking; and history of cardiovascular disease. The details are described elsewhere in the literature [17].
Study 2 investigated the clinical contributors to a decrease of 10 mg/dL or more in HDL-C over 10 years (outcome) in middle-aged women (40 - 64 years), as analyzed using a logistic regression model (n = 90,053, AUC 68.4%) possessing 10 explanatory factors, including age; BMI; serum TG, HDL-C, and low-density lipoprotein cholesterol (LDL-C) levels; self-reported pharmacotherapy for dyslipidemia; smoking status; frequency and amount of alcohol drinking; and serum γ-glutamyl transferase (GGT) level. The details are described elsewhere in the literature [18].
Study 3 investigated the clinical contributors to a certain percentage (%) increase in bodyweight from the baseline as a continuous variable (outcome), as analyzed using a GLM and the same data as those used in study 1.
Study 4 investigated the clinical contributors to high systolic blood pressure (outcome) in the 86,151 medical students aged 18 - 34 years, as analyzed using open data [21] and seven explanatory factors, including age, sex, heart rate, serum cholesterol level, and smoking, diabetes, and obesity (BMI ≥ 30 kg/m2) statuses. In this study, high systolic blood pressure was redefined as ≥ 135 mm Hg.
Study 5 investigated the clinical contributors to permanent neonatal diabetes mellitus (outcome), as analyzed using 100,000 pediatric open data [22] and seven explanatory factors, including age, genetic information, family history, birthweight, developmental delay, and HbA1c and insulin levels.
Statistical analysis
To estimate the average age, we transformed the age groups (40 - 44, 45 - 49, 50 - 54, 55 - 59, 60 - 64, and 65 - 70 years) to substituted ages (s-ages), corresponding to the median age for each group (i.e., 42, 47, 52, 57, 62, and 68 years, respectively).
In all the studies except for study 3, binary logistic regression analysis was conducted by considering explanatory variables as confounding factors, yielding odds ratios and WCS values for each covariate. In this study, to obtain the stBs, all the related covariates were standardized, and logistic regression analysis was conducted. In addition, negative stBs were replaced with the corresponding absolute values before assessing the correlations because both WCS values and FI are positive (> 0). Pearson and Spearman correlations were used to assess the linear and rank correlations, respectively. All the statistics were analyzed using the SAS system, version 9.4 (SAS Institute, Cary, NC, USA). A two-tailed test for which P < 0.05 was considered as significant.
In five studies, we used an artificial intelligence analysis system (Prediction One®, Sony Network Communications, Inc., Tokyo, Japan) [23] with gradient-boosted decision tree and neural network algorithms to calculate FI. Prediction One utilizes Neural Network Libraries, a deep-learning open-source software package developed by Sony [24]. To improve the general applicability and prevent overfitting of the model, five and two classified groups were cross-validated in studies 1-3 and 4 and 5, respectively [24-26].
| Results | ▴Top |
Figures 1-3 show the scatter plots of the natural-logarithm-transformed WCS values and FI in three studies. Overall, although the covariates’ WCS values were highly correlated with FI, some lower-value factors were replaced in the order of precedence. Figure 1 shows that age, smoking status, sex, serum TG level, and BMI, in descending order, are the factors that most strongly influence a 10% increase in bodyweight over 10 years, as analyzed based on FI.
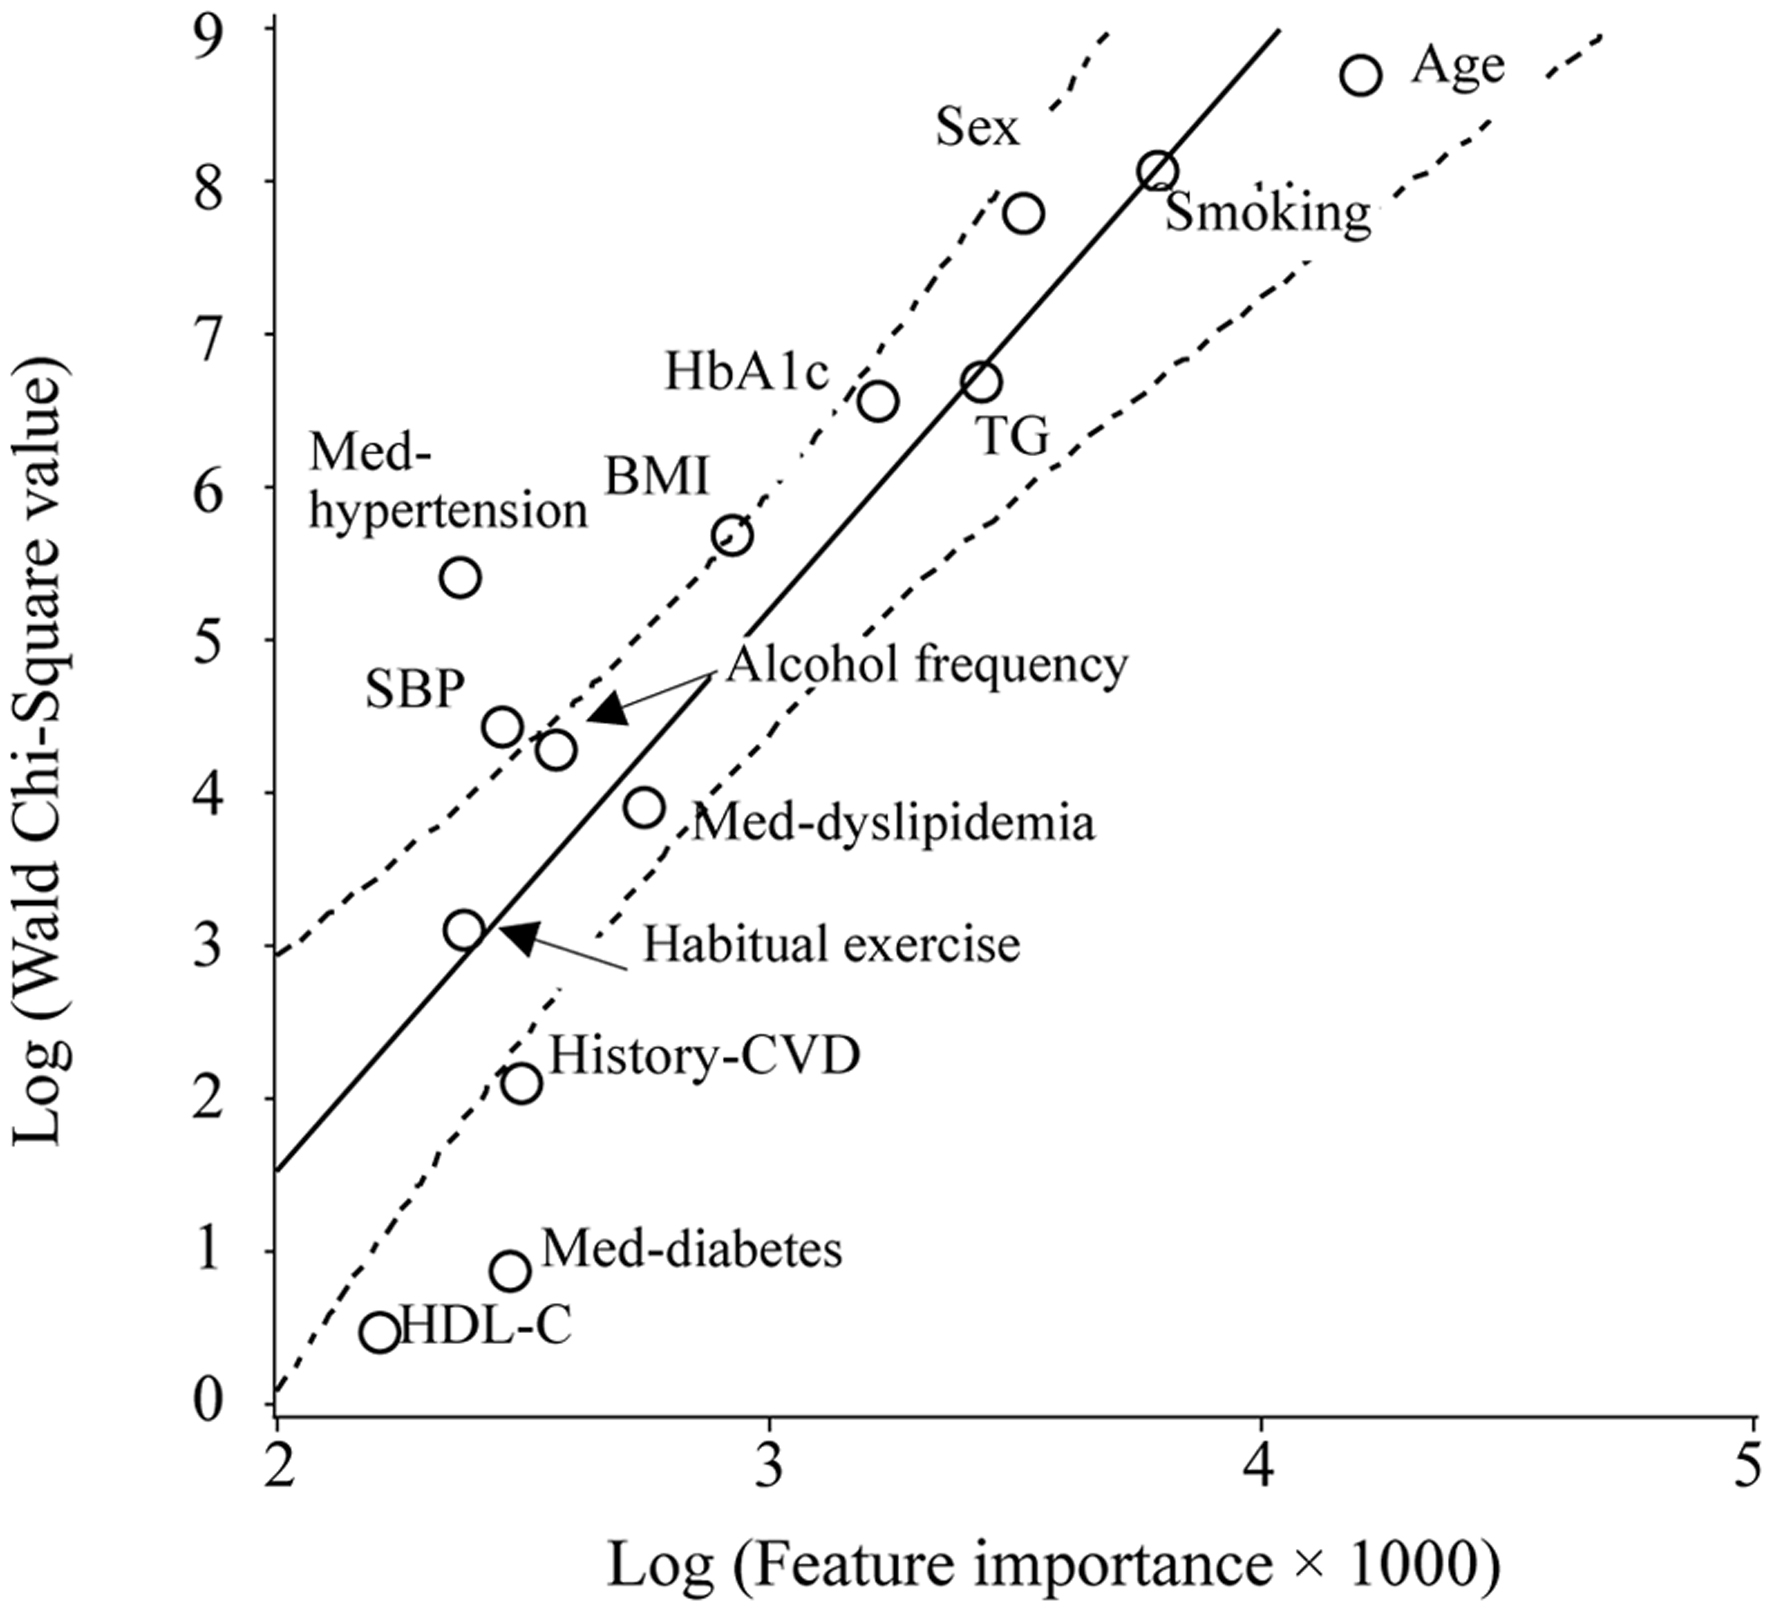 Click for large image | Figure 1. Scatter plot of the natural logarithm of the WCS values and FI for the outcome of a 10% increase in bodyweight over 10 years. The WCS values of the age, smoking status, sex, TG and HbA1c levels, BMI, pharmacotherapy for hypertension, systolic blood pressure, weekly alcohol consumption, pharmacotherapy for dyslipidemia, habitual exercise status, history of cardiovascular disease, pharmacotherapy for diabetes, and HDL-C level are 5,903, 3,170, 2,414, 800, 701, 293, 221, 83, 71, 50, 22, 8, 2, and 2, respectively. The solid and dotted lines represent the regression line and 95% CI, respectively. |
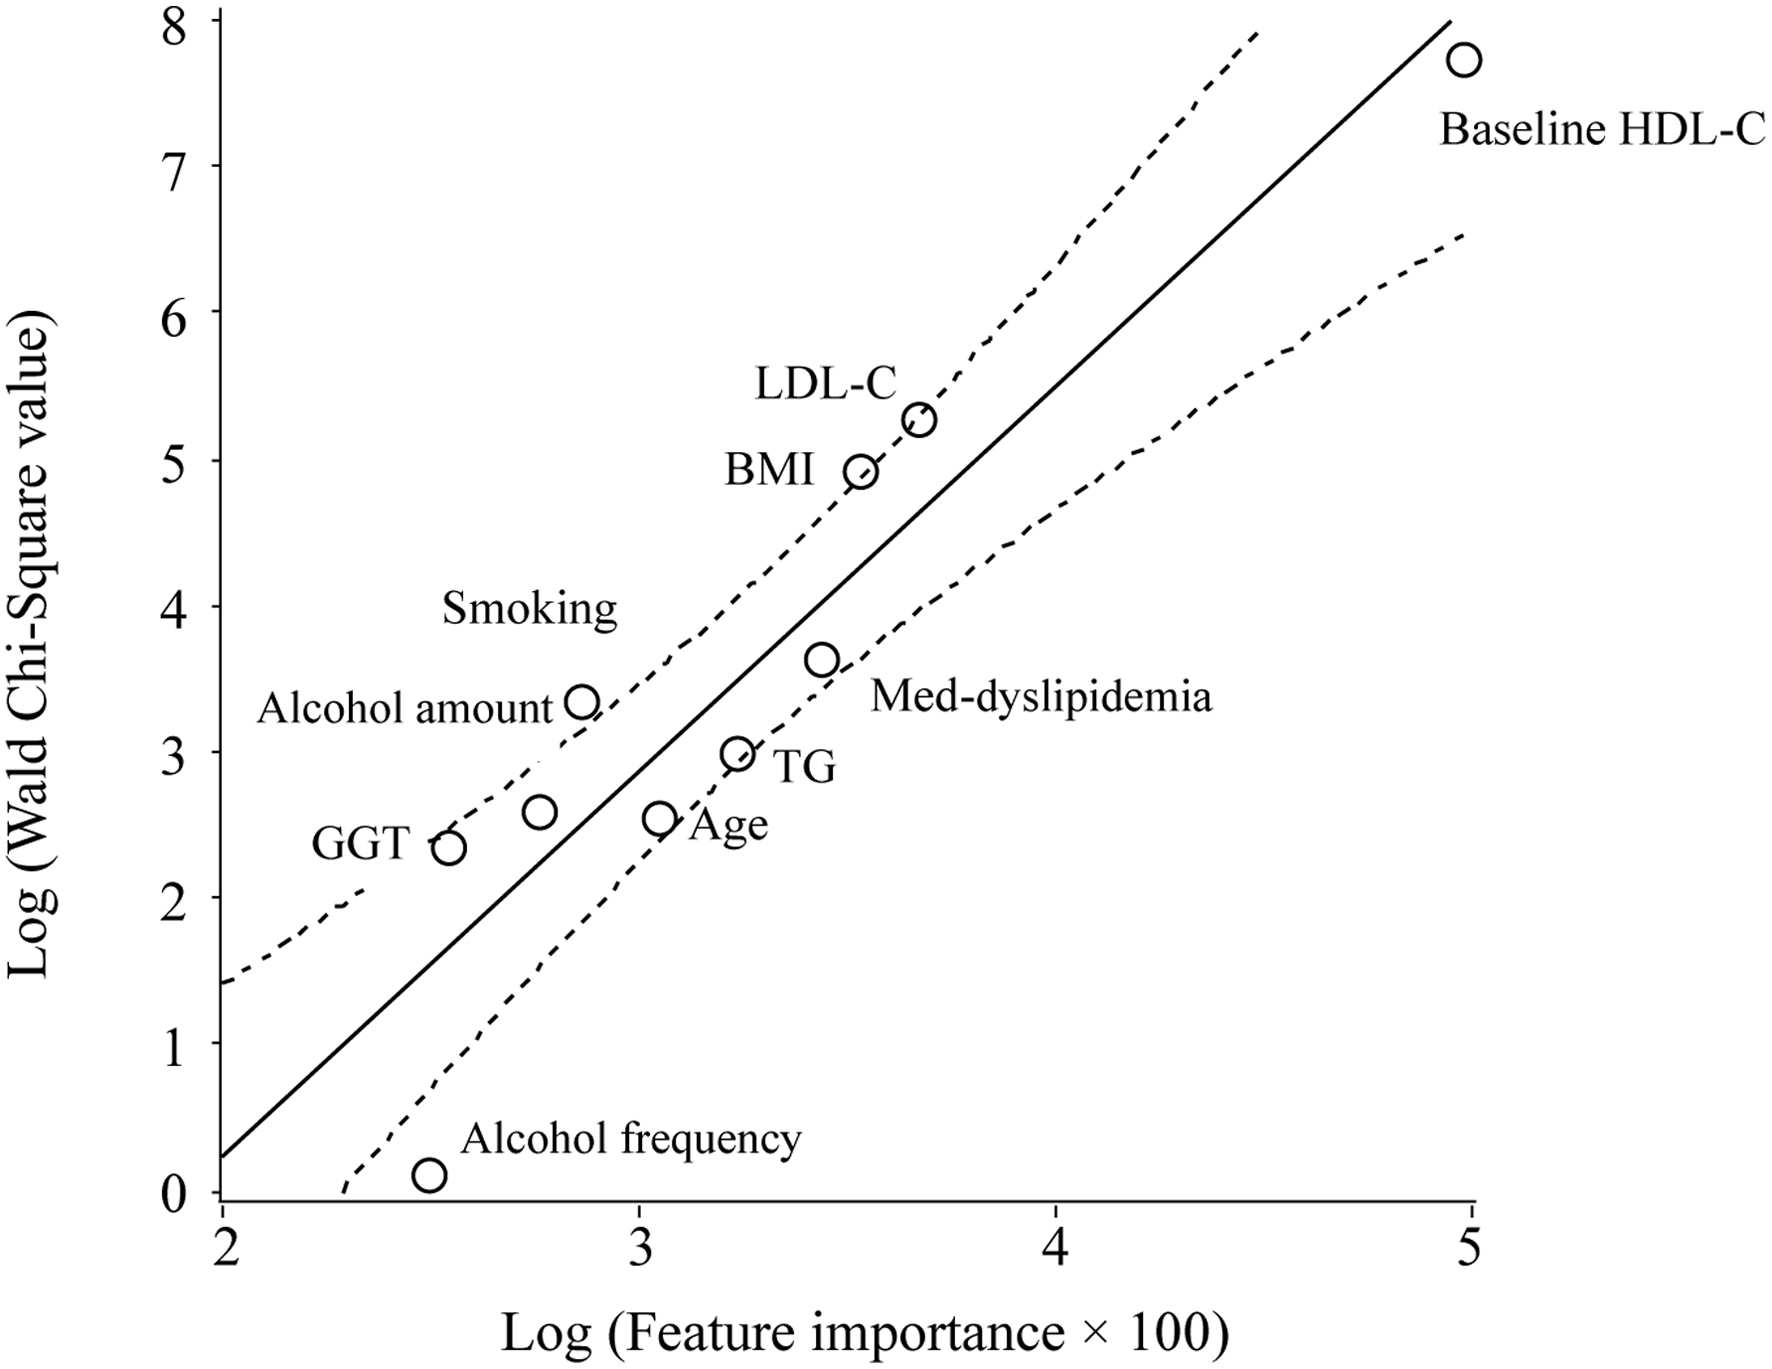 Click for large image | Figure 2. Scatter plot of the natural logarithm of the WCS values and FI for the outcome of a decrease of 10 mg/dL or more in the HDL-C level over 10 years. The WCS values of the HDL-C and LDL-C levels, BMI, pharmacotherapy for dyslipidemia, TG level, age, smoking status, amount of alcohol consumed per session, GGT level, and weekly alcohol consumption are 2,282, 193, 134, 38, 19, 13, 28, 13, 10, and 1, respectively. The solid and dotted lines represent the regression line and 95% CI, respectively. |
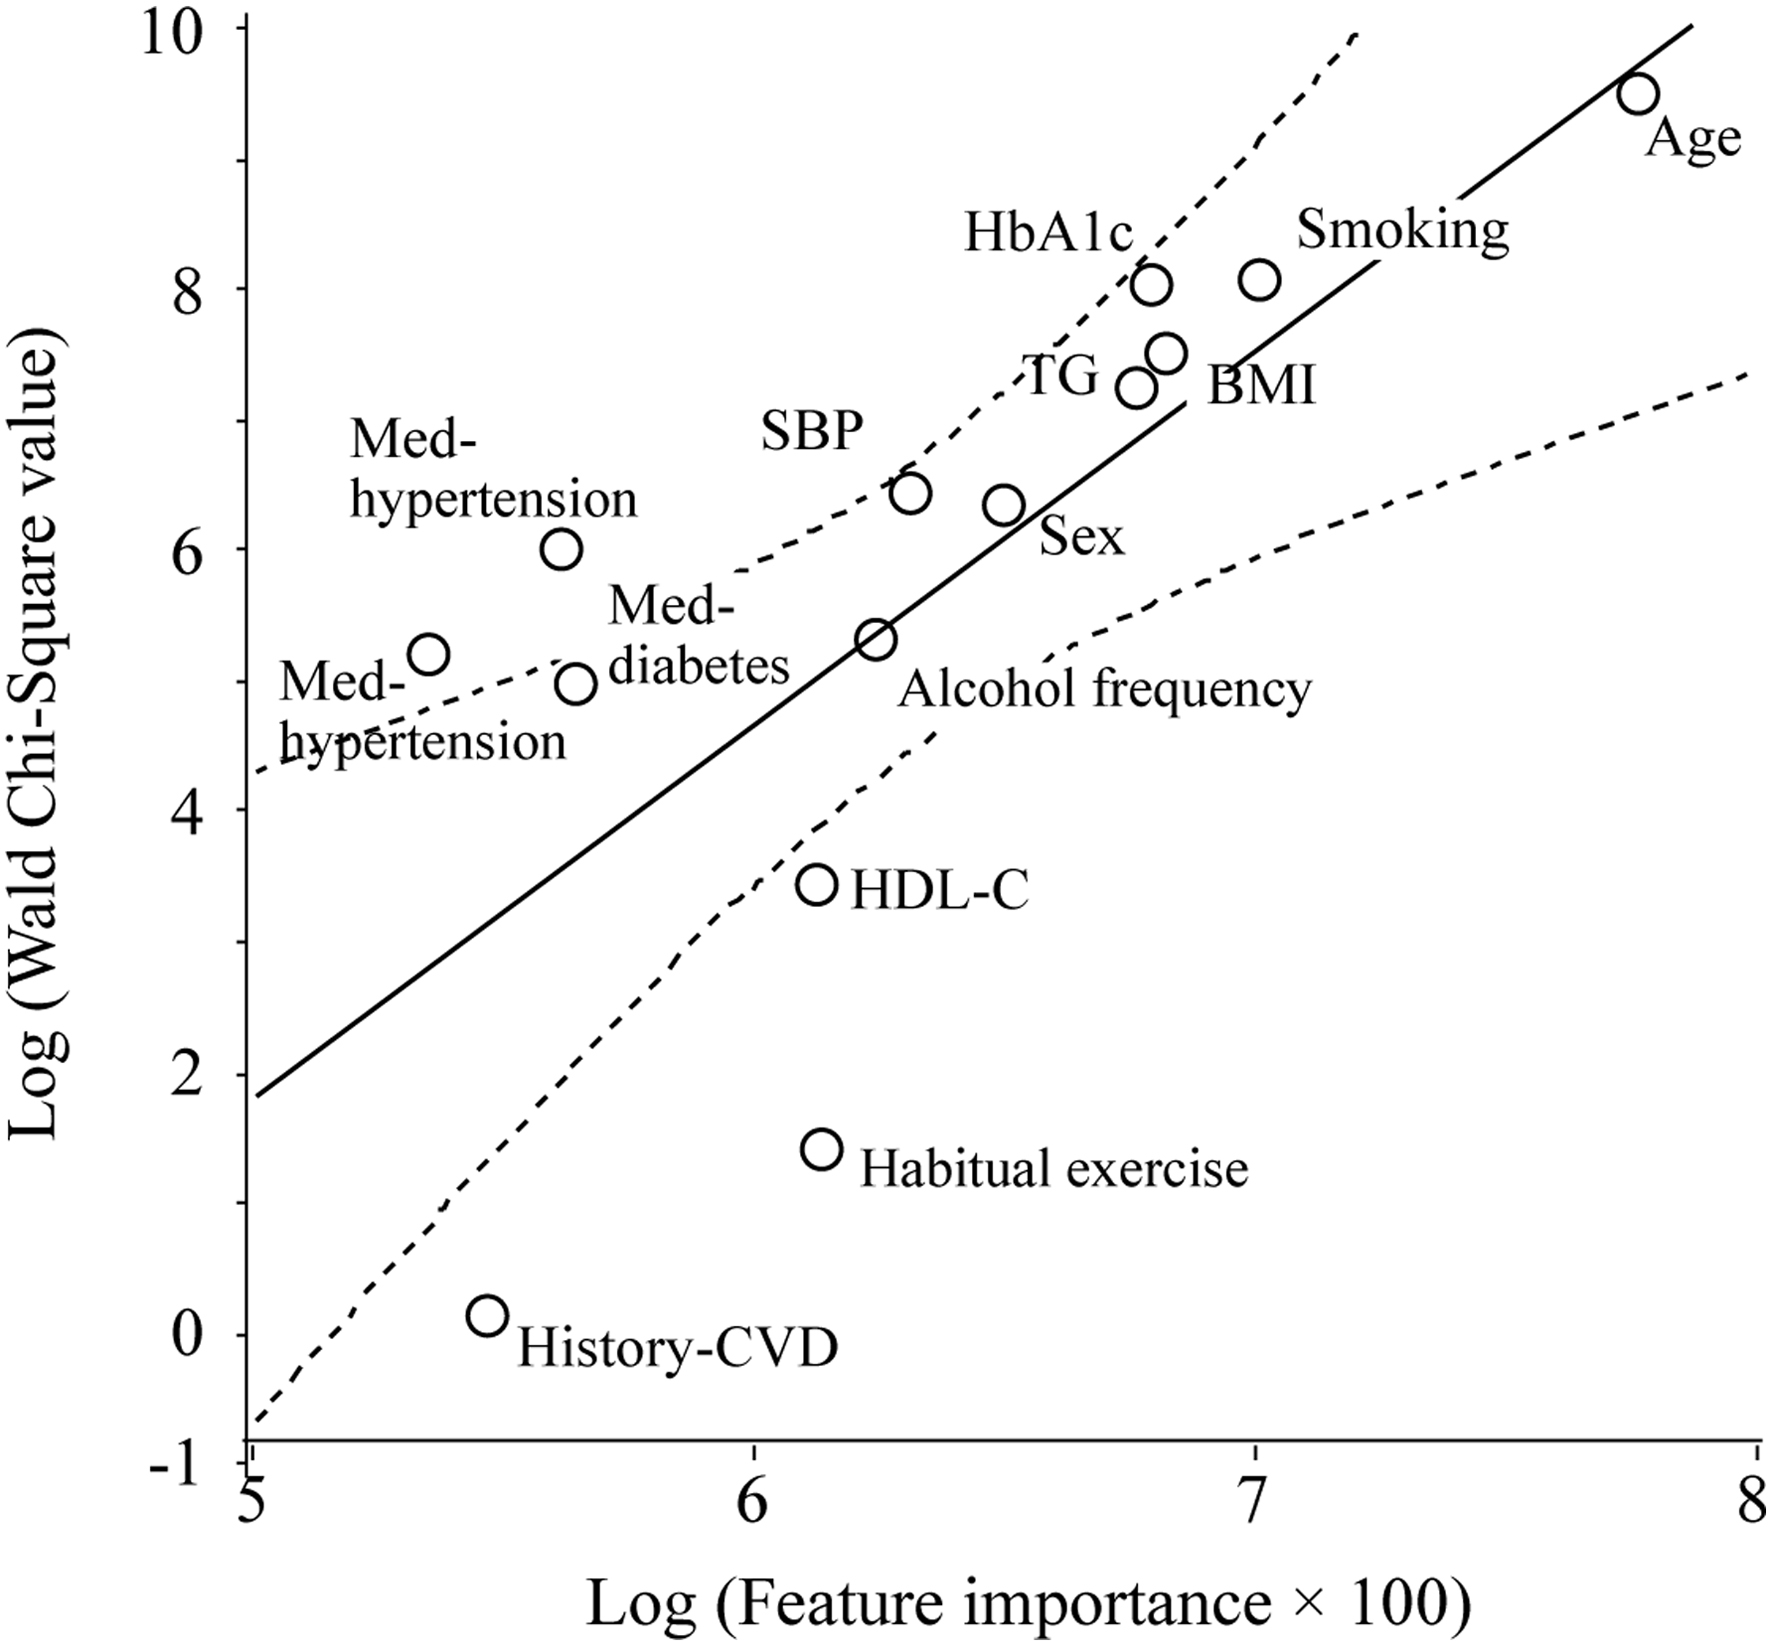 Click for large image | Figure 3. Scatter plot of the natural logarithm of the WCS values and FI for the outcome of a percentage (%) change in bodyweight over 10 years, as analyzed using a GLM. The WCS values of the age, smoking status, HbA1c level, BMI, TG level, systolic blood pressure, sex, pharmacotherapy for hypertension, weekly alcohol consumption, pharmacotherapies for diabetes and dyslipidemia, HDL-C level, habitual exercise status, and history of cardiovascular disease are 12,979, 2,996, 2,835, 1,676, 1,310, 578, 505, 360, 177, 161, 126, 26, 3, and 1, respectively. The solid and dotted lines represent the regression line and 95% CI, respectively. |
Figure 2 shows that the baseline serum HDL-C and LDL-C levels, BMI, dyslipidemia medication (MED), and serum TG level, in descending order, are the factors that most strongly influence a decrease of 10 mg/dL or more in the HDL-C level over 10 years.
Figure 3 shows that age, smoking status, BMI, HbA1c and TG (these have almost the same magnitude) levels, and sex, in descending order, are the factors that most strongly influence the percentage (%) change in bodyweight over 10 years, as analyzed using a GLM.
Table 1 shows the correlations between the WCS values and FI. In the larger-scale study (study 1), WCS values were more highly correlated with FI (Spearman correlation, ρ = 0.84, P = 0.0002) than stBs (ρ = 0.80, P = 0.0006). However, WCS values were very highly correlated with the absolute values of stBs (Pearson correlation, r = 0.96, P < 0.0001 and ρ = 0.93, P < 0.0001). As in study 2, WCS values were more highly correlated with FI (ρ = 0.94, P < 0.0001) than the absolute values of stBs (ρ = 0.73, P = 0.016). WCS values were highly correlated with the absolute values of stBs (r = 0.99, P < 0.0001 and ρ = 0.83, P = 0.003). In study 3, a GLM was used to calculate the WCS values and stBs for the bodyweight percentage (%) as a continuous variable. The WCS values and absolute values of stBs were similarly highly correlated with FI (ρ = 0.87, P < 0.0001 and ρ = 0.85, P = 0.0001). However, the WCS values were very highly correlated with the absolute values of stBs (r = 0.95, P < 0.0001 and ρ = 0.99, P < 0.0001). For these three studies, the WCS values, stBs, and FI are shown in Supplementary Material 1 (aicm.elmerpub.com).
 Click to view | Table 1. Correlation of FI With WCS and stB |
Table 2 shows the stBs, absolute values of stBs, WCS values, and FI in studies 4 and 5. In study 4, according to the WCS values, the heart rate, cholesterol level, sex, obesity and smoking statuses, age, and diabetes status, in descending order, were the explanatory factors that most strongly influenced high systolic blood pressure. According to the stBs and WCS values, the factors’ orders of precedence were substantially different from that of the factors according to FI. Although the AUCs were low in both logistic regression analysis (51.6%) and machine learning (54.2%), the WCS values were significantly correlated with FI (ρ = 0.79, P = 0.036). The absolute values of stBs were correlated to the same degree with FI (ρ = 0.79, P = 0.036), indicating that the orders of precedence of the contributions were identical for the WCS values and the absolute values of stBs. Consistently, the WCS values were very highly correlated with the absolute values of stBs (r = 0.96, P = 0.0005 and ρ = 1.00, P < 0.0001), indicating that the covariates’ orders of precedence were identical according to both WCS values and stBs.
Click to view | Table 2. Results of Logistic Regression Analysis After Standardization of Covariates and FI by Machine Learning |
In study 5, because of its high stBs, genetic information was excluded from the model, leaving only six factors. According to the WCS values, stBs; age; birthweight; family history; HbA1c and insulin levels; and developmental delay, in descending order, were the explanatory factors that most strongly influenced high systolic blood pressure. According to the stBs and WCS values, the factors’ orders of precedence were slightly different from that of the factors according to FI. In both logistic regression analysis (87.5%) and machine learning (70.2%), the AUCs were relatively high. WCS values were significantly correlated with FI (r = 0.99, P = 0.0001 and Spearman correlation, ρ = 0.83, P = 0.042), whereas the absolute values of stBs were similarly highly correlated with FI (r = 0.99, P = 0.0002 and ρ = 0.83, P = 0.042). Consistently, the WCS values were very highly correlated with the absolute values of stBs (r = 0.99989, P < 0.0001 and ρ = 1.0000, P < 0.0001).
| Discussion | ▴Top |
To the best of our knowledge, this is the first study to evaluate the correlations between the absolute values of stBs and WCS values in logistic regression analysis and GLMs and FI calculated using machine learning in clinical studies. These results suggest that covariates’ WCS values likely represent the magnitude of the covariates’ influences on outcomes, which is consistent with the very high correlation degree between WCS values and stBs. Although the results obtained for both open studies can be reproduced, Japan’s MHLW will not allow the reproduction of the data from the former three studies.
Because stBs approximate the relative importances of variables in outcomes [4, 5], WCS values should also approximate the variables’ relative importances. WCS values are automatically provided in the results obtained using logistic regression analysis and GLMs without any additional spadework, such as covariate standardization and numerical conversion. In contrast, in logistic regression analysis, the procedure for calculating stBs is often complex because related covariates, including categorical variables, must first be converted to numerical values and standardized.
Machine learning and data mining may still be unfamiliar to many investigators, particularly in clinical practice, because of the difficulty in interpretating results, complexity in preparing the setup, and high cost of commercially available graphical user interface (GUI) software.
Therefore, stBs and FI could be replaced with WCS values as a surrogate index for analyzing covariates’ influences on and contributions to outcomes, which may be linked to the effective treatment and prevention of diseases by indicating priorities in clinical practice and public health.
Ideally, the magnitudes of the influences of various covariates, including fundamental factors, such as age, sex, BMI, and smoking, hypertension, and diabetes statuses, on outcomes should be ranked in clinical practice and public health studies so that clinical practitioners and patients can more easily understand covariates’ priorities and their relation to strategies for treating diseases.
In study 4, the covariates’ orders of precedence were substantially different according to WCS values and FI. The most plausible reason for these conflicting results may be the low AUCs (52-54%), indicating that the analysis model and enrolling covariates were inappropriate and should be improved [27]. Therefore, caution should be exercised in determining the appropriateness of the analysis model before assessing WCS values, stBs, and FI.
In contrast, in studies 1-3 (Supplementary Material 1, aicm.elmerpub.com), although the covariates’ orders of precedence slightly differed according to the WCS values, stBs, and FI, the index that most accurately represented the covariates’ influences on outcomes was unclear. Presently, combinations of these indices, for instance, ordering by WCS values and either FI or stBs might be feasible solutions to this problem. Therefore, the cases where the discrepancies between WCS values and both FI and stBs grow must be verified.
Indeed, odds, risk, and hazard ratios of specific factors are important indices in clinical studies. However, the odds and risk ratios of numerical values, such as age (in years), BMI, and blood pressure, are often very low because these ratios represent the effect of an increase of one unit on the outcome. In addition, high odds and risk ratios often have wide 95% confidence interval (CI) ranges, suggesting low reliability [28]. Therefore, for investigators who do not adopt FI calculated using machine learning, the odds, risk, and hazard ratios; WCS values; and other indices might have to be defined for approximating covariates’ influences on outcomes.
Unfortunately, the theory underlying the correlations between WCS values and both FI, and stBs remains unclear. The method for calculating FI is quite different from those for calculating WCS values and stBs, and the calculation of FI and its types can vary among machine-learning algorithms [29, 30]. Furthermore, because of database and software limitations, these results might be coincidental. However, the significant correlations between stBs and WCS values, which were very high in all five studies, are unlikely to be coincidental. Notably, in addition to the high correlation degree between WCS values FI, the WCS values and stBs were very highly correlated.
In considering models’ overall prediction accuracies, several investigators have used WCS values [31] to approximate covariates’ relative importances and contributions to outcomes and models [32, 33] and the relative strengths of associations [34].
Although WCS statistics are primarily used to confirm the significance of partial regression coefficients estimated based on the null hypothesis that the partial regression coefficient is zero [35], to the best of our knowledge, other uses of WCS values have been neither fully elucidated nor validated.
Partial correlation coefficients (φ), which are used to adjust confounding factors, may also approximate covariates’ relative importances [36]. However, this analysis is based on a linear relationship and is applicable to numeric variables’ dependent and independent factors.
According to the equation for calculating WCS values, they can be enlarged for big data, as in studies 1-3 (Supplementary Material 1, aicm.elmerpub.com) and 5 (Table 2), probably because of the large sample sizes (n) and negligibly different β-coefficients and standard deviations. Consequently, WCS values enable variables’ influences on outcomes to be distinguished easily because the differences between covariates’ WCS values simultaneously grow.
In contrast, stBs vary in narrow ranges (usually from -1.0 to +1.0) and positive and negative directions and likely provide detailed information about covariates’ contributions to outcomes; however, because of these small differences, caution should be exercised for evaluating the contribution of a specific factor, relative to those of other factors, to outcomes.
Limitations
This study has several notable limitations. First, because these results were obtained using limited databases, the theory underlying the high correlation degrees was not validated and will remain challenging until plausible hypotheses are proposed. Second, WCS values, stBs, FI, and AUCs can change according to the models used and covariates enrolled, even in the same study and database [37]. Multicollinearity between covariates, model overfitting, and skewed data also affect these indices [29, 38]. Furthermore, because of its inherent bias, FI is not an absolute index for assessing covariates’ contributions to outcomes, which has been extensively argued for the last decade [37, 39].
In conclusion, the results of this empirical study suggest that similar to stBs, WCS values, which are usually provided in regression analysis, may approximate covariates’ relative importances to outcomes. According to the magnitudes of WCS values, variables’ priorities may be linked to the effective prevention and treatment of diseases in clinical practice, although the implementation of this concept in clinical practice remains challenging. Further study will be needed to verify these results and revisit the statistical significance of WCS values in nontraditional applications.
| Supplementary Material | ▴Top |
Suppl 1. Results of logistic regression analysis after standardization of covariates and FI by machine learning in three studies. The factors used for the studies 1-3, and their stB, WCS, and FI are listed in descending order based on the value of WCS.
Acknowledgments
We would like to thank Edanz (https://jp.edanz.com/ac) for editing a draft of this manuscript.
Financial Disclosure
This research was supported by the Research Institute at Japan Women’s University, grant number 84.
Conflict of Interest
The authors declare no conflict of interest.
Informed Consent
Not applicable.
Author Contributions
KN contributed to the overall study design. KN and AS contributed to the interpretation of the initial analysis and discussion of the literature. KN prepared the first draft of the manuscript. All the authors have read and approved the final version of the manuscript and agreed to the published version.
Abbreviations
AUC: area under the curve; BMI: body mass index; CI: confidence interval; GGT: γ-glutamyl transferase; GLM: generalized linear model; GUI: graphical user interface; HbA1c: glycated hemoglobin; HDL-C: high-density lipoprotein cholesterol; LDL-C: low-density lipoprotein cholesterol; Med: medication; stB: standardized β-coefficient; TG: triglyceride; WCS: Wald Chi-squared
| References | ▴Top |
- McNutt LA, Wu C, Xue X, Hafner JP. Estimating the relative risk in cohort studies and clinical trials of common outcomes. Am J Epidemiol. 2003;157(10):940-943.
doi pubmed - Grimes DA, Schulz KF. Making sense of odds and odds ratios. Obstet Gynecol. 2008;111(2 Pt 1):423-426.
doi pubmed - Standardized Regression Coefficient. Essential statistical methods for medical statistics, 2011. https://www.sciencedirect.com/topics/mathematics/standardized-regression-coefficient#definition.
- Roustaei N. Application and interpretation of linear-regression analysis. Med Hypothesis Discov Innov Ophthalmol. 2024;13(3):151-159.
doi pubmed - The Shortcomings of Standardized Regression Coefficients | UVA Library. https://library.virginia.edu/data/articles/the-shortcomings-of-standardized-regression-coefficients. (Accessed on April 3, 2025).
- Grace JB, Johnson DJ, Lefcheck JS, Byrnes JEK. Quantifying relative importance: computing standardized effects in models with binary outcomes. Ecosphere. 2018;9(6):e02283.
- Wicklin R. Standardize regression coefficients for models that include categorical variables. 2023. https://blogs.sas.com/content/iml/2023/07/17/standardize-reg-coeff-class.html.
- Wojtas M, Chen K. Feature importance ranking for deep learning. In: Larochelle H, Ranzato MA, Hadsell R, Balcan MF, Lin HT, editors, advances in neural information processing systems 33: Annual Conference on Neural Information Processing Systems. NeurIPS. 2020.
- Musolf AM, Holzinger ER, Malley JD, Bailey-Wilson JE. What makes a good prediction? Feature importance and beginning to open the black box of machine learning in genetics. Hum Genet. 2022;141(9):1515-1528.
doi pubmed - Binson VA, Thomas S, Subramoniam M, Arun J, Naveen S, Madhu S. A Review of machine learning algorithms for biomedical applications. Ann Biomed Eng. 2024;52(5):1159-1183.
doi pubmed - Dola SS, Valderrama CE. Exploring parental factors influencing low birth weight on the 2022 CDC natality dataset. BMC Med Inform Decis Mak. 2024;24(1):367.
doi pubmed - Huang AA, Huang SY. Use of feature importance statistics to accurately predict asthma attacks using machine learning: A cross-sectional cohort study of the US population. PLoS One. 2023;18(11):e0288903.
doi pubmed - Wald test - Wikipedia. Accessed on Feb 3, 2025
- Kawaguchi T, Azuma K, Yamaguchi T, Iwase S, Matsunaga T, Yamada K, Miyamatsu H, et al. Preferences for pharmacist counselling in patients with breast cancer: a discrete choice experiment. Biol Pharm Bull. 2014;37(11):1795-1802.
doi pubmed - Suto M, Iba A, Sugiyama T, Kodama T, Takegami M, Taguchi R, Niino M, et al. Literature review of studies using the national database of the health insurance claims of Japan (NDB): limitations and strategies in using the NDB for research. JMA J. 2024;7(1):10-20.
doi pubmed - Kimura Y, Jo T, Matsui H, Yasunaga H. Clinical research using real-world data: A narrative review. Respir Investig. 2024;62(6):929-934.
doi pubmed - Nakajima K, Sekine A, Higuchi R, Enokido M, Matsui S. Possible pitfalls in the prediction of weight gain in middle-aged normal-weight individuals: Results from the NDB-K7Ps-study-2. Obes Res Clin Pract. 2024;18(4):255-262.
doi pubmed - Sekine A, Nakajima K. Moderate-to-heavy alcohol consumption may cause a significant decrease in serum high-density lipoprotein cholesterol in middle-aged women: a cohort study of the national database study in the Kanto 7 prefectures-4. Cureus. 2024;16(3):e55467.
doi pubmed - Ministry of health, labour and welfare. Health examination and guidance program for Japanese adults. 2008. Available online: https://www.mhlw.go.jp/bunya/shakaihosho/iryouseido01/info02a.html. Accessed on April 4, 2025.
- Study of seven Kanto prefectures using the national database. https://mcm-www.jwu.ac.jp/∼NDB-K7Ps/blog/?page_id=2.
- Medical Students Dataset. https://www.kaggle.com/datasets/slmsshk/medical-students-dataset.
- PNDM Prediction Dataset. https://www.kaggle.com/datasets/slmsshk/pndm-prediction-dataset?resource=download.
- Sony Network Communications, Prediction One. Available online: https://www.predictionone.sony.biz (accessed on April 4, 2025).
- Neural Network Libraries. https://nnabla.org/ja/.
- Gupta A, Kulkarni M, Mukherjee A. Accurate prediction of B-form/A-form DNA conformation propensity from primary sequence: A machine learning and free energy handshake. Patterns (N Y). 2021;2(9):100329.
doi pubmed - Reps JM, Ryan P, Rijnbeek PR. Investigating the impact of development and internal validation design when training prognostic models using a retrospective cohort in big US observational healthcare data. BMJ Open. 2021;11(12):e050146.
doi pubmed - Corbacioglu SK, Aksel G. Receiver operating characteristic curve analysis in diagnostic accuracy studies: A guide to interpreting the area under the curve value. Turk J Emerg Med. 2023;23(4):195-198.
doi pubmed - Murad MH, Tomlinson GA, Brignardello-Petersen R, Wang Z, Lin L. Confidence intervals of the relative risk and odds ratio can predict when the optimal information size in a meta-analysis is not met. J Clin Epidemiol. 2025;179:111653.
doi pubmed - Loh WY, Zhou P. Variable importance scores. J Data SCI. 2021;19(4):569-592.
- Takefuji Y. Beyond XGBoost and SHAP: Unveiling true feature importance. J Hazard Mater. 2025;488:137382.
doi pubmed - Sheikh MA, Lund E, Braaten T. The predictive effect of body mass index on type 2 diabetes in the Norwegian women and cancer study. Lipids Health Dis. 2014;13:164.
doi pubmed - The rank ordering of WCSs is a rough indicator of the relative importance of each varaiable in the contributing to the overall goodness of fit of the model. https://www150.statcan.gc.ca/n1/pub/75-512-x/2006001/t/5203370-eng.htm. (Accessed on April 4, 2025).
- Judelson DR, Simons JP, Flahive JM, Patel VI, Healey CT, Nolan BW, Bertges DJ, et al. Determinants of follow-up failure in patients undergoing vascular surgery procedures. Ann Vasc Surg. 2017;40:74-84.
doi pubmed - Suarez-Pierre A, Fraser CD, Zhou X, Crawford TC, Lui C, Metkus TS, Whitman GJ, et al. Predictors of operative mortality among cardiac surgery patients with prolonged ventilation. J Card Surg. 2019;34(9):759-766.
doi pubmed - Ordered Logistic Regression | SPSS Annotated Output. https://stats.oarc.ucla.edu/spss/output/ordered-logistic-regression/.
- Partial correlation coefficient. partial correlation coefficient - an overview. Science Direct Topics.
- Everette K. Variable importance performance when multicollinearity is present. MUSC Theses and Dissertations. 2021;584.
- Takefuji Y. Reassessing feature importance biases in machine learning models for infection analysis. J Infect. 2024;89(6):106357.
doi pubmed - Adler AI, Painsky A. Feature importance in gradient boosting trees with cross-validation feature selection. Entropy (Basel). 2022;24(5):687.
doi pubmed
This article is distributed under the terms of the Creative Commons Attribution Non-Commercial 4.0 International License, which permits unrestricted non-commercial use, distribution, and reproduction in any medium, provided the original work is properly cited.
AI in Clinical Medicine is published by Elmer Press Inc.