| AI in Clinical Medicine, ISSN 2819-7437 online, Open Access |
| Article copyright, the authors; Journal compilation copyright, AI Clin Med and Elmer Press Inc |
| Journal website https://aicm.elmerpub.com |
Original Article
Volume 2, 2026, e15

A Machine Learning Model to Guide Computed Tomography Angiography Use in Acute Gastrointestinal Bleeding: A Decision-Support Tool for Gray-Zone Cases
Riya Guptaa, g, Shyam Chandrab, Nikhil Beharic, Ryan Lia, Alyssa Changd, Keagan Yape, Audrey Change, Aman Mohapatraf, g
aDepartment of Biostatistics, Harvard T.H. Chan School of Public Health, Boston, MA,
USA
bDepartment of Biomedical Informatics, Harvard Medical School, Boston, MA,
USA
cDepartment of Media Arts and Sciences, Massachusetts Institute of
Technology, Cambridge, MA, USA
dDepartment of Computer Science, Harvard
University, Cambridge, MA, USA
eHarvard College, Cambridge, MA,
USA
fDivision of Gastroenterology, Department of Medicine, Beth Israel Deaconess
Medical Center, Boston, MA, USA
gCorresponding Authors: Riya Gupta, Department
of Biostatistics, Harvard T.H. Chan School of Public Health, Boston, MA 02115, USA; Aman
Mohapatra, Division of Gastroenterology, Department of Medicine, Beth Israel Deaconess Medical
Center, Boston, MA, USA
Manuscript submitted January 3, 2026, accepted January 30, 2026, published online February 10,
2026
Short title: Predicting Positive CTA in GI Bleeds Using ML
doi:
https://doi.org/10.14740/aicm15
| Abstract | ▴Top |
Background: Computed tomography (CT) angiography (CTA) is an essential imaging tool in gastrointestinal (GI) bleeding but lacks clear guidance for use among hospitalized patients who develop new or worsening bleeding after admission, where hemodynamic findings and endoscopic visualization are often equivocal. These “gray-zone” cases create uncertainty about whether CTA will yield actionable results. We aimed to develop and evaluate an interpretable machine learning (ML) model to estimate the probability of a positive CTA in this inpatient context and support selective, evidence-based imaging decisions.
Methods: We retrospectively analyzed 11,938 patients with GI bleeding from the MIMIC-IV database, a publicly available inpatient database from Beth Israel Deaconess Medical Center. Among 890 CTA studies, 140 met inclusion criteria after excluding non-bleeding indications and incomplete laboratory data, including 32 CTA-positive and 108 CTA-negative examinations. A logistic-regression model with Synthetic Minority Oversampling Technique (SMOTE) upsampling was trained using seven routine laboratory features—hemoglobin, hematocrit, international normalized ratio (INR), blood urea nitrogen, and platelets—measured within the 24 h preceding the CTA order. Model performance was assessed using F1 score, recall, and area under the receiver operating characteristic curve (ROC-AUC).
Results: The model achieved an F1 score of 0.71, recall of 0.68, and ROC-AUC of 0.71, outperforming random forest and XGBoost classifiers. Key predictors included Δ-hemoglobin, Δ-hematocrit, and maximum INR, which captured physiologic patterns associated with active bleeding.
Conclusions: This proof-of-concept model demonstrates that routine inpatient laboratory data can predict the likelihood of a positive CTA among patients with suspected GI bleeding during hospitalization. By quantifying imaging yield using data already available in the electronic health record, the model offers a practical, interpretable framework to guide selective CTA utilization, reduce unnecessary scans, and improve multidisciplinary decision-making.
Keywords: Gastrointestinal bleeding; CT angiography; Machine learning; Decision support; Predictive modeling
| Introduction | ▴Top |
Gastrointestinal (GI) bleeding remains a common and high-impact clinical problem, with mortality ranging from 5% to 10% depending on severity and source [1]. Rapid localization of bleeding is essential to guide timely endoscopic or interventional management.
Standard diagnostic evaluation follows a structured hierarchy: initial clinical assessment and stabilization, endoscopic evaluation when feasible, and selective imaging for patients with ongoing or recurrent bleeding. Computed tomography (CT) angiography (CTA) serves as a rapid, noninvasive tool capable of detecting active arterial extravasation, localizing bleeding sites, and guiding transcatheter embolization or surgical therapy [2–4]. Current ACG consensus recommendations support CTA when scoping is delayed, inconclusive, or impractical in the context of active bleeding [2].
Nevertheless, CTA is not indicated for all presentations of GI bleeding. Its selective use must balance diagnostic yield against risks—contrast nephropathy, radiation exposure, and cost—as well as operational constraints such as scanner availability and radiology throughput [3–5]. Overuse increases patient and system burden, while underuse risks missed opportunities for timely localization. Consequently, CTA occupies a targeted role within the diagnostic algorithm—most valuable when endoscopic visualization is limited or when rapid localization is needed to guide therapy [6].
The greatest uncertainty arises in the clinical “gray zone”—patients who are neither frankly unstable nor entirely stable. Many such patients are already hospitalized for other conditions and subsequently develop new or worsening signs of GI bleeding after initial stabilization, often reflected by evolving hemoglobin trends or subtle hemodynamic shifts. In these inpatient scenarios, clinicians must decide whether the available laboratory and clinical data justify CTA. While current guidelines provide hemodynamic thresholds for instability, they offer little direction for these intermediate, post-admission decisions.
Within the broader field of GI bleeding research—now encompassing more than 12,000 publications worldwide [7]—most studies emphasize endoscopic or interventional outcomes rather than pre-imaging triage. Yet this decision critically influences diagnostic yield, timing of therapy, and healthcare resource utilization.
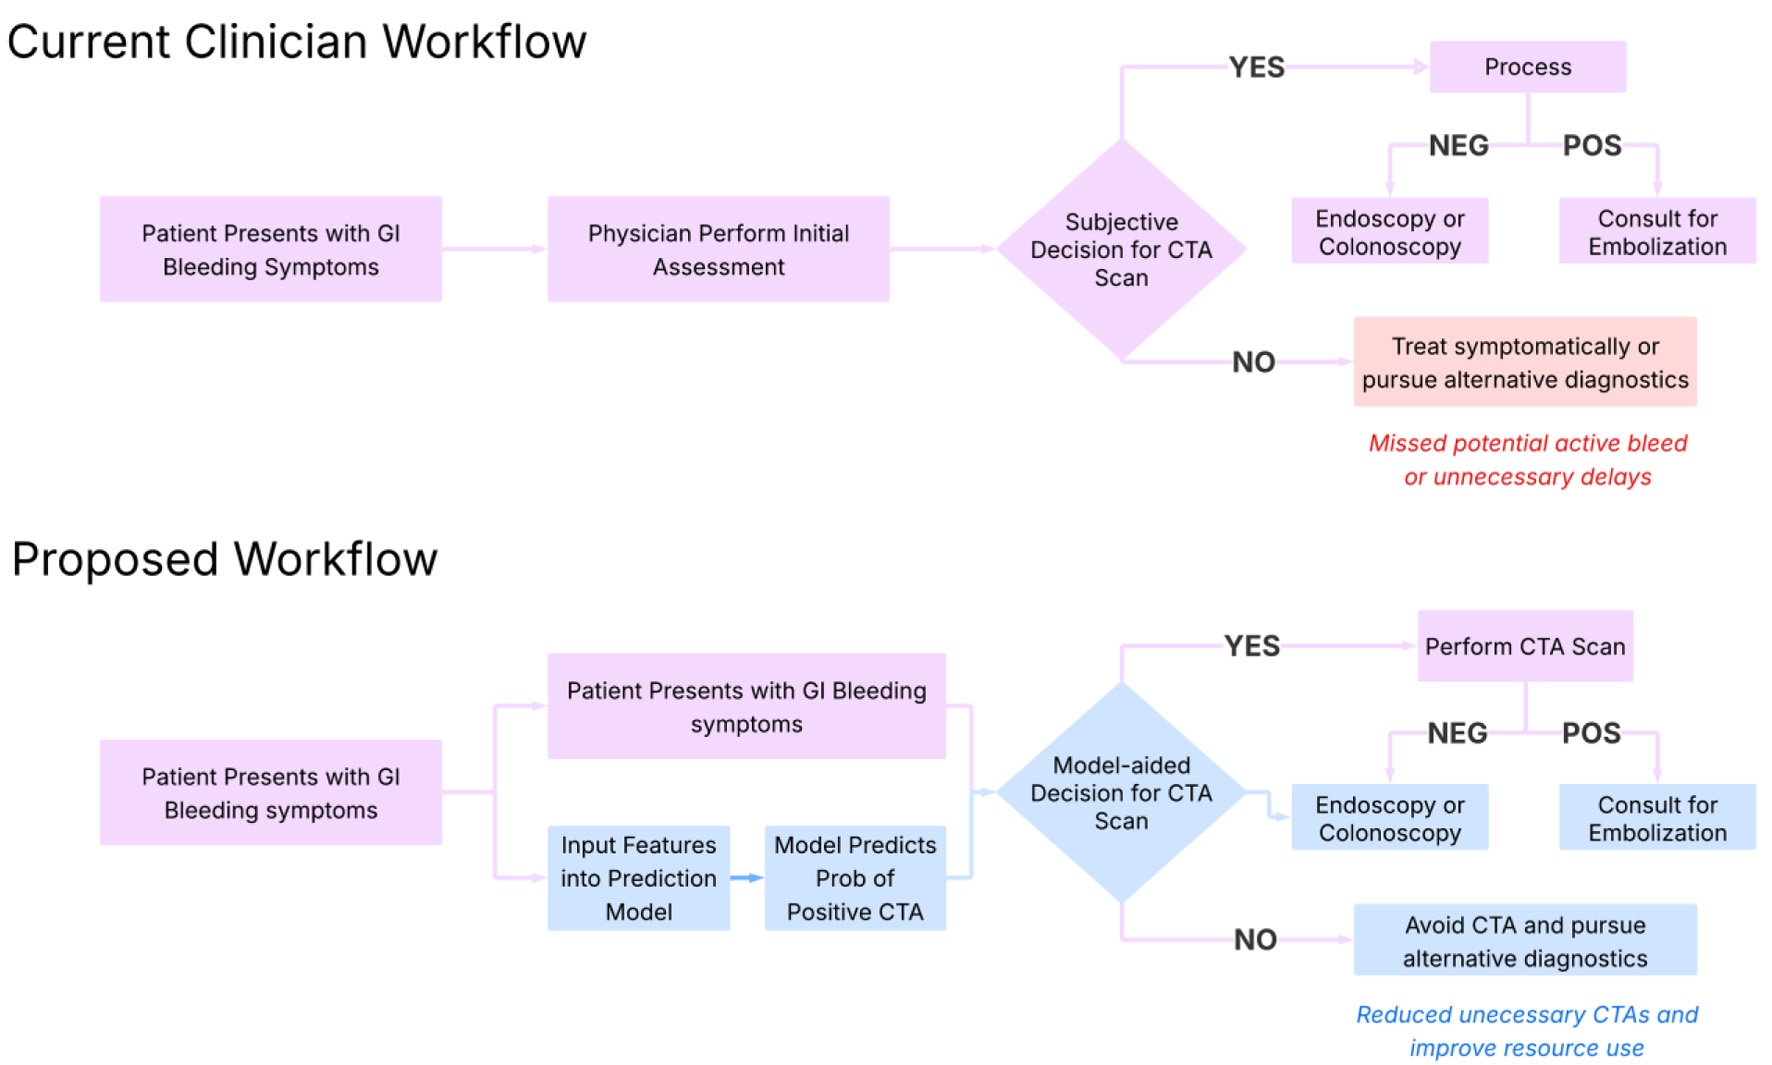
To address this gap, we developed an interpretable machine-learning (ML) model that predicts the likelihood of a positive CTA using routine inpatient laboratory data available up to the time a CTA is being considered (Fig. 1). The model is designed specifically for hospitalized patients who develop suspected GI bleeding ≥ 24 h after admission, when serial laboratory values already exist. By quantifying the probability of a positive imaging result based on physiologic trends such as Δ-hemoglobin and international normalized ratio (INR), the model aims to support selective, evidence-informed CTA utilization in this inpatient gray-zone setting—complementing clinical judgment rather than replacing it.
 Click for large image |
Figure 1. Proposed clinical workflow for implementation of the model. This diagram outlines a step-by-step integration of the machine learning model into clinical practice. Starting with patient presentation and lab draw, the model ingests key laboratory values (e.g., hemoglobin, INR, BUN) to generate a predicted probability of a positive CTA. Based on this probability and clinical context, the model stratifies patients into high- and low-likelihood categories, guiding providers on whether to pursue immediate CTA or consider alternative diagnostics. This approach supports real-time, evidence-informed decision-making for intermediate-risk cases. BUN: blood urea nitrogen; CTA: computed tomography angiography; INR: international normalized ratio. |
| Materials and Methods | ▴Top |
Study design and objective
This retrospective model-development study aimed to simulate a real-world clinical decision-support tool for patients who develop new or worsening GI bleeding during hospitalization and are hemodynamically indeterminate. In such cases, clinicians often face diagnostic uncertainty about whether to order CTA to localize bleeding. Our goal was to develop an interpretable ML model that predicts the probability of a positive CTA based on routine laboratory data available during the onset of new or worsening bleeding, thereby guiding imaging decisions for inpatient bleeds.
This framework differs from conventional diagnostic-accuracy studies of CTA yield. Rather than evaluating all hospitalized patients or those presenting to the emergency department, we focused specifically on the post-admission population—patients already hospitalized for another condition who subsequently developed signs or symptoms of GI bleeding. The model is thus intended for use after a clinician identifies possible bleeding and before a CTA order is placed, serving as a triage aid for gray-zone decision-making.
Data source and initial cohort identification
We used the publicly available, de-identified MIMIC-IV database of inpatient encounters at Beth Israel Deaconess Medical Center [8]. Among 11,938 hospitalizations with documentation of GI bleeding, we identified all abdominal CTAs performed during admission using natural language processing (NLP) through Python. CTAs obtained within the first 24 h of admission were excluded to focus on suspected inpatient-acquired or worsening bleeds—the clinical scenario in which CTA is typically reconsidered after initial stabilization.
This yielded 890 abdominal CTA scans across 607 unique patients (Fig. 2).
 Click for large image |
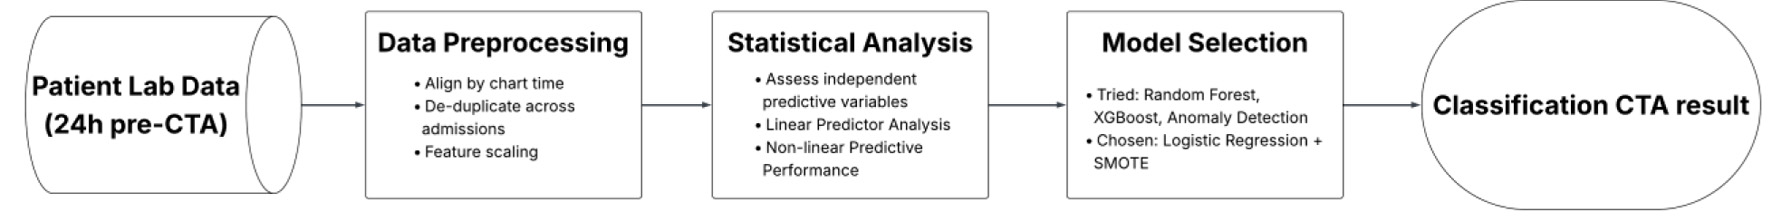
Figure 2. Workflow for developing an interpretable logistic regression model to assist CTA decision-making. This flowchart outlines the sequential steps in developing an interpretable logistic regression model to assist CTA decision-making. Using routinely available labs from 24 h prior to imaging, the workflow includes data preprocessing, statistical evaluation of features, model selection with SMOTE upsampling, and final performance tuning focused on sensitivity to minimize missed bleeds. CTA: computed tomography angiography; SMOTE: Synthetic Minority Oversampling Technique. |
Cohort refinement
Radiology reports were screened to confirm that CTAs were obtained for clinical concern for GI bleeding rather than unrelated indications (e.g., trauma, postoperative hemorrhage). Two independent reviewers applied prespecified keyword criteria (e.g., “GI bleed,” “melena,” “hematochezia”) and reached consensus under supervision of the clinical investigator. Reviewers were blinded to CTA outcomes to prevent bias. After excluding non-bleed indications, incomplete imaging, duplicates, or missing laboratory data within 24 h before CTA, 140 studies (32 positive, 108 negative) remained for modeling. CTA positivity was defined strictly as radiologist-documented active arterial contrast extravasation within the GI tract. Studies demonstrating only secondary or nonspecific findings without active extravasation were classified as negative. This definition was chosen to align the outcome with actionable imaging yield rather than downstream management decisions.
Feature extraction and engineering
All feature extraction was anchored to the CTA order time to ensure that only pre-imaging information available to clinicians was included. Seven routinely available laboratory features were selected based on physiologic relevance and accessibility in routine inpatient workflows. These included maximum and minimum hemoglobin, Δ-hemoglobin, Δ-hematocrit, maximum INR, minimum platelet count, closest blood urea nitrogen (BUN) value to 24 h preceding the CTA order time. All patients who had a CTA were retained even if laboratory results were unavailable within the timeframes of interest. Missing lab values were treated as NaN rather than exclusion criteria. No CTA cases were excluded solely due to missing laboratory values, reflecting real-world variability in data availability at the time CTA is being considered. For final reported analyses, only labs obtained within 24 h prior to CTA were included. This approach ensured that all predictors represented real-time clinical data that could have informed the decision to order a CTA.
The 24-h window for hemoglobin and hematocrit captures the acute physiologic trajectory of bleeding—values that fluctuate rapidly and directly influence imaging decisions. Δ-hemoglobin and Δ-hematocrit were time-normalized by dividing the absolute change by the elapsed hours between draws, allowing comparability across patients with differing sampling frequencies. To reduce bias from informative sampling, only patients with at least two hemoglobin/hematocrit measurements in the 24-h window were included in delta calculations.
All laboratory variables were obtained from structured MIMIC-IV tables. Outliers were manually inspected, and biologically implausible values (e.g., INR > 20) were excluded prior to model development.
Feature univariate analysis
In order to investigate whether our chosen features are independently relevant in distinguishing positive and negative CTA results we used statistical tests (t-test and Mann–Whitney U test), Bayesian inference, effect size calculations, and permutation importance analysis. We note that this analysis was meant to motivate the development of a predictive model, but did not suggest predictive ability in univariate analysis (Table 1).
 Click to view |
Table 1. Univariate Statistical Findings and
Model-Level Impact for Candidate Predictors (24-h Pre-CTA) |
Model development and evaluation
Supervised ML models (logistic regression, random forest, and XGBoost) were trained to classify CTA outcome (positive vs. negative). To address class imbalance, Synthetic Minority Oversampling Technique (SMOTE) was applied. Logistic regression was selected for final deployment due to superior interpretability and comparable performance across cross-validation folds. Model performance was assessed using fivefold cross-validation and evaluated with accuracy, precision, recall, F1 score, and ROC-AUC metrics (Table 2). To help quantify the total predictive contribution of each feature, we used a random forest predictor for computing importance.
Click to view |
Table 2. Performance Metrics Across
Classification and Anomaly Detection Models for Predicting CTA-Positive GI
Bleeding |
| Results | ▴Top |
Univariate feature analysis prior to model
Univariate analysis demonstrated that maximum INR was the only feature to reach statistical significance between positive and negative CTA groups (t-test P = 0.009; Cohen’s d = 0.34), indicating higher values among CTA-positive cases (Table 1). Closest BUN trended toward significance (P = 0.12) and exhibited a small effect size (Cohen’s d = 0.25). Bayesian inference similarly supported maximum INR as the strongest discriminator (P(mean diff > 0) = 0.00), while Δ-hemoglobin showed a moderate probability of higher variability in the positive group (P(mean diff > 0) = 0.79). Minimum hematocrit (P = 0.23; d = 0.25) and maximum hematocrit (P = 0.25; d = 0.24) demonstrated small but directionally consistent group differences. Non-linear permutation importance analysis identified maximum hematocrit (importance = 0.090), closest BUN (0.052), and maximum INR (0.052) as the top contributors to overall predictive variance, followed by Δ-hemoglobin (0.041). In contrast, minimum platelet count (P = 0.67; importance < 0.01) and raw hemoglobin values (P > 0.45) were poorly separated between groups. Collectively, these findings confirmed that maximum INR, maximum hematocrit, and closest BUN carried the most consistent univariate signals, motivating their inclusion in multivariable model development despite several features not achieving individual statistical significance.
Model performance
Performance metrics for all models are summarized in Table 2. Among the three classifiers tested, logistic regression with SMOTE upsampling achieved the most balanced overall performance, with the highest precision (0.82) and F1 score (0.71), and strong recall (0.75). Random forest demonstrated slightly higher raw recall but at the cost of lower precision, indicating over-identification of positives. XGBoost performed comparably in ROC-AUC but showed reduced calibration stability and a tendency toward overfitting in this small dataset.
Overall, logistic regression with SMOTE provided the best trade-off between sensitivity and precision, offering interpretable coefficients and robust generalizability for deployment as a real-world decision-support tool. These findings are consistent with prior clinical ML studies emphasizing transparency and balance in small, imbalanced cohorts.
Feature importance in final model
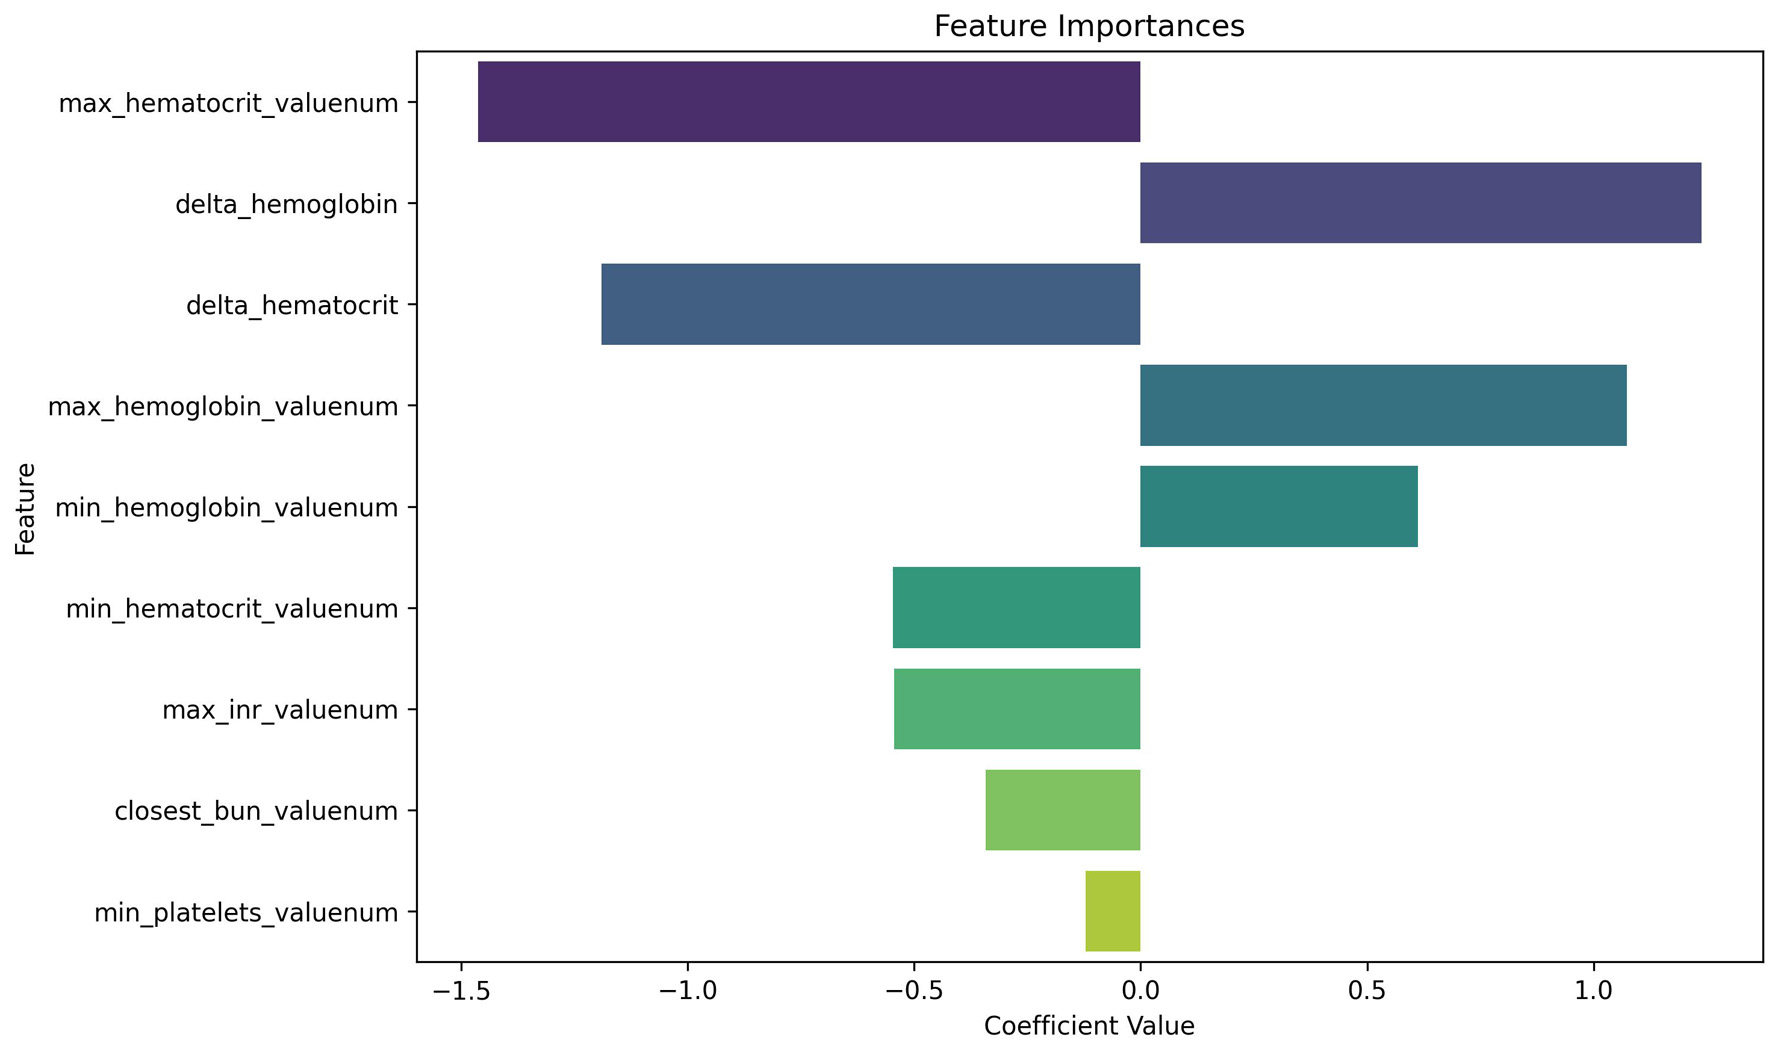
Table 1 summarizes results from univariate analysis and raw feature distribution. Some variables appeared less significant when considered individually but gained importance in the full model. Figure 3 presents the multivariable feature importance based on the logistic regression model. The maximum hematocrit, Δ-hemoglobin and Δ-hematocrit emerged as the most influential predictors of a positive CTA. These features demonstrated strong contributions within the multivariable model despite being nonsignificant in univariate analysis, highlighting the added predictive power of combined variables in context. This divergence between univariate and multivariable perspectives underscores the value of feature engineering and the interpretability of logistic regression in understanding complex clinical interactions. Because all continuous predictors were standardized prior to model fitting, the reported odds ratios correspond to a one–standard deviation increase in each laboratory variable rather than a one-unit increase. For example, for maximum INR, the estimated odds ratio of 0.58 indicates that higher INR values are associated with lower odds of a positive CTA after adjusting for the other variables in the model. Specifically, a one–standard deviation increase in maximum INR is associated with an approximately 42% reduction in the odds of the outcome, holding all other factors constant. However, the 95% confidence interval for this estimate (0.30, 1.12) includes 1, indicating that this association is not statistically significant. The same interpretation applies to closest BUN and minimum platelet count. Odds ratios from the standardized multivariable logistic regression model are provided in Table 3; confidence intervals and P-values are reported only for variables with reliably estimable standard errors.
 Click for large image |
Figure 3. Logistic regression coefficients for predicting positive CTA. This plot displays the relative importance of laboratory features in the logistic regression model. In our analysis, we use a random forest predictor for computing importance; our findings therefore rely on random forest assumptions, including independence of variable shuffling. Negative coefficients (left of zero) are associated with decreased likelihood of a positive CTA, while positive coefficients (right of zero) increase predicted probability. Max hematocrit and delta hemoglobin emerged as highly influential predictors, despite being statistically non-significant on univariate analysis—highlighting the value of multivariable modeling. CTA: computed tomography angiography. |
Click to view |
Table 3. Multivariable Standardized Logistic
Regression Coefficients and Odds Ratios for Model Predicting CTA
Positivity |
Several laboratory features, including minimum, maximum, and delta values for hemoglobin and hematocrit, exhibited substantial multicollinearity, which limited reliable estimation of standard errors. As a result, confidence intervals and P-values are not reported for these variables, and their corresponding odds ratios should be interpreted as unstable and descriptive of model behavior rather than inferential estimates of independent effect.
| Discussion | ▴Top |
Clinical relevance
This study demonstrates the feasibility of using routine inpatient laboratory data to guide selective CTA utilization for patients who develop new or worsening signs of GI bleeding during hospitalization. Unlike prior literature emphasizing endoscopic or interventional outcomes, our model addresses a critical operational gap—how to triage equivocal, inpatient bleeding episodes when the indication for CTA remains uncertain [7]. In these gray-zone cases, decision-making often relies on gestalt or incomplete data; our model provides an objective, interpretable adjunct that synthesizes laboratory information already available in the electronic health record (EHR).
Importantly, the tool is designed for real-time inpatient decision support, not as a universal diagnostic test across all bleeding presentations. All features reflect laboratory trends preceding the CTA order, capturing the physiologic trajectory that typically prompts clinicians to consider imaging. By anchoring predictions to information available at the time of decision-making, the model mirrors real-world clinical reasoning rather than relying on future or post-imaging data.
Achieving a modest yet balanced ROC-AUC of 0.71, the best-performing model modestly distinguishes patients most likely to have positive CTA findings, offering interpretable, data-driven support for timely and selective imaging decisions. In this context, model performance should be interpreted as decision-support rather than diagnostic accuracy. The goal is not to independently mandate imaging, but to shift pre-test probability in clinically ambiguous cases where existing guidance is limited, analogous to other risk stratification tools used to inform—but not replace—clinical judgment. When integrated into EHR systems, such a model could prompt multidisciplinary review or escalation in ambiguous cases, thereby improving both diagnostic yield and resource allocation.
Interpretability and feature dynamics
Multivariable modeling revealed physiologic relationships that extend beyond univariate trends. Δ-hemoglobin emerged as a strong positive predictor of CTA positivity, reflecting acute blood loss, whereas Δ-hematocrit demonstrated a negative coefficient—likely influenced by concurrent fluid resuscitation and dilutional effects [9]. These coefficient directions should be interpreted cautiously, as several hemoglobin- and hematocrit-derived variables were highly correlated, limiting stable estimation of individual effects and rendering odds ratios descriptive of model behavior rather than independent causal associations. Maximum hematocrit, though nonsignificant alone, gained importance within the full model, suggesting that it may mark dynamic volume shifts during evolving hypovolemia or early compensation.
INR remained predictive in both univariate and multivariable analyses, consistent with its established role in coagulopathy and impaired hemostasis [10]. The inclusion of INR enhances both model accuracy and face validity from a clinical perspective. BUN, while not a strong univariate predictor, gained multivariate relevance, possibly reflecting systemic hypoperfusion or physiologic stress independent of bleed source [11]. Platelet count contributed minimally to overall performance, likely reflecting its limited specificity for active extravasation once INR and hemoglobin dynamics are accounted for [12].
Collectively, these findings underscore the clinical interpretability of logistic regression and the importance of contextualizing laboratory trends within the physiologic evolution of bleeding. The model’s transparent coefficients allow bedside clinicians to reason through its predictions, bridging the gap between ML and clinical intuition.
Model comparison and justification
As summarized in Table 2, the native logistic regression model with SMOTE upsampling provided the most balanced and clinically interpretable performance among all classifiers, achieving the best combination of precision, recall, and F1 score. Tree-based methods such as random forest and XGBoost achieved marginally higher raw accuracy but demonstrated poorer calibration and lower discriminative stability, reflecting overfitting in a small, imbalanced dataset.
These findings highlight the advantages of SMOTE-augmented logistic regression in low-prevalence, structured clinical data [13]. Oversampling improved representation of positive CTA cases without distorting laboratory distributions, while the logistic framework preserved interpretability and probabilistic calibration—both essential for bedside integration and clinician trust.
In contrast, unsupervised anomaly-detection models (Autoencoder, One-Class SVM, Isolation Forest) displayed superficially high precision and recall but low ROC-AUC, indicating poor true discrimination. Such patterns are typical in rare-event detection, where positive cases are not statistical outliers but represent directional physiologic trends requiring labeled supervision. These results reaffirm that supervised models with structured oversampling provide more clinically meaningful predictions than outlier-based approaches [14].
Collectively, the comparative results in Table 2 demonstrate that, for selective CTA prediction, sensitivity-oriented, interpretable models like logistic regression with SMOTE strike the most appropriate balance between accuracy, transparency, and real-world deployability. As such, this logistic framework provides a scalable foundation for prospective validation and workflow integration.
Economic and implementation value
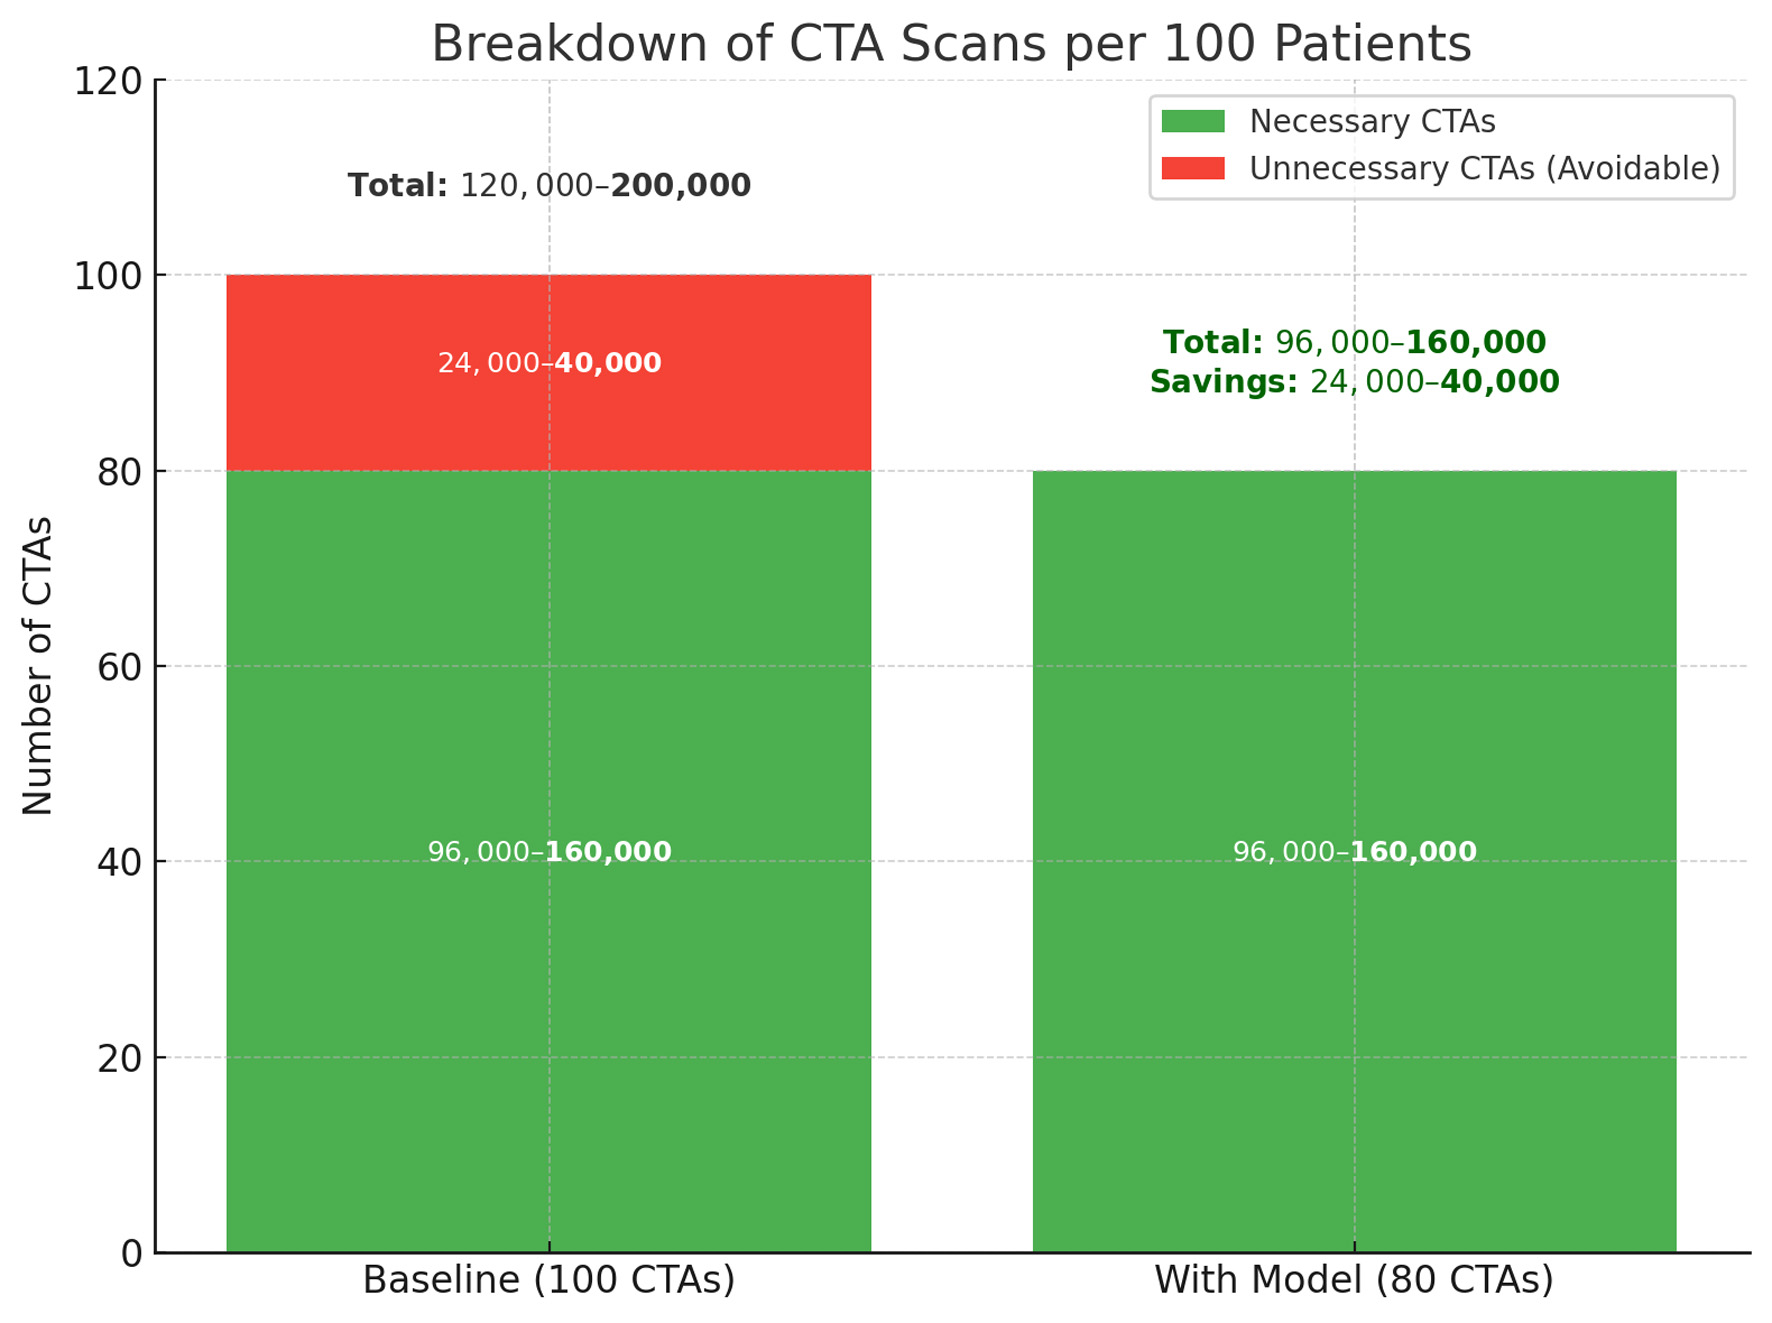
Reducing non-yield CTA use could produce both clinical and institutional benefits. Based on prior cost analyses [5], avoiding approximately 20 unnecessary scans per 100 patients may yield savings exceeding $80,000 per 100 cases, alongside reduced radiation exposure and contrast risk (Fig. 4). These improvements align with ALARA principles and broader efforts toward value-based imaging [6].
 Click for large image |
Figure 4. Projected reduction in unnecessary CTA scans with model implementation. The left column represents baseline imaging practice, where 24,000–40,000 of every 100,000 CTAs are estimated to be unnecessary. The right column shows the anticipated effect of model-assisted triage, which reduces avoidable CTAs by 20% while preserving all necessary scans. This change corresponds to a direct reduction in imaging volume, with estimated savings between 24,000 and 40,000 scans per 100,000 patients. CTA: computed tomography angiography. |
Because the model relies solely on structured, routinely collected data, it can be seamlessly embedded into ordering workflows in systems such as Epic or Cerner. When combined with clinician oversight, this could streamline triage discussions and reduce delays in definitive therapy. More broadly, selective imaging informed by data-driven prediction represents a step toward precision diagnostics—aligning patient-level decisions with resource stewardship and safety priorities across healthcare systems.
Limitations and future directions
This single-center, retrospective study included a modest sample of 140 CTA cases, which may limit generalizability. Because the analytic cohort was limited to patients in whom clinicians elected to pursue CTA, the model estimates the conditional probability of CTA positivity given that CTA was already under consideration. Patients who proceeded directly to endoscopic, angiographic, or surgical intervention without CTA are not represented. This conditioning introduces selection bias and limits interpretation to imaging yield in clinically equivocal inpatient cases, rather than appropriateness of CTA ordering across all hospitalized GI bleeding presentations. External validation in larger, multicenter cohorts will be necessary. In addition, the limited number of CTA-positive events constrains the effective events-per-variable ratio, increasing the risk of coefficient instability given multiple correlated laboratory features. For this reason, the analysis prioritized physiologically motivated predictors and interpretable modeling over complexity. Coefficient estimates should therefore be interpreted as descriptive of model behavior in this proof-of-concept setting rather than definitive measures of independent effect.
Because the cohort was intentionally limited to patients for whom CTA was clinically contemplated for suspected GI bleeding, the model reflects a defined decision-support context rather than a diagnostic-accuracy framework.
The model relied on seven routine laboratory features available up to the time of CTA order, representing some data typically accumulated during early hospitalization. While this mirrors real-world inpatient decision-making, it limits applicability for immediate triage at presentation. Future versions could incorporate continuously updating laboratory and hemodynamic data to enable earlier, real-time prediction.
Additional clinical variables—such as vital signs, medication use, and transfusion history—were unavailable, and variable laboratory timing may have affected delta-based features despite restricting all inputs to pre-CTA values. Prospective validation with standardized temporal anchors and integration into EHR workflows will be essential to confirm reproducibility and clinical utility.
Some unexpected statistical patterns were observed. In multivariate modeling, Δ-hematocrit and minimum/maximum hematocrit demonstrated negative coefficients, whereas Δ-hemoglobin was positive. Δ-hemoglobin showed moderate significance in univariable testing, while Δ-hematocrit did not. These differences likely reflect collinearity and physiologic confounding, as hematocrit can be influenced by fluid shifts once hemoglobin variation is accounted for. Future studies should explore these relationships using expanded covariates and time-sequenced data to better capture bleeding dynamics.
Despite these limitations, this proof-of-concept model provides a transparent, data-driven framework for selective CTA utilization in GI bleeding and lays the groundwork for prospective evaluation, EHR integration, and refinement through ensemble or deep-learning architectures while maintaining interpretability.
Conclusions
In summary, this study presents an interpretable framework for estimating CTA yield in hospitalized patients with suspected GI bleeding using routine laboratory trends available at the time of imaging consideration. Changes in hemoglobin and hematocrit, along with INR and BUN, emerged as key contributors to imaging yield in this clinically ambiguous setting. By formalizing information already used implicitly in practice, the model offers structured support for selective CTA utilization while preserving clinician judgment. Prospective validation and broader integration will be required to confirm generalizability and clinical impact.
Acknowledgments
The authors thank Beth Israel Deaconess Medical Center for their contributions to the MIMIC-IV database. We acknowledge the support of our clinical and data science colleagues who provided feedback during model development. This work represents a collaboration between students from Harvard University and Harvard T.H. Chan School of Public Health, and we are grateful for the support and resources provided by both institutions.
Financial Disclosure
No funding was received for this study.
Conflict of Interest
The authors declare that they have no competing interests.
Informed Consent
Not applicable. This study used publicly available, de-identified data from the MIMIC-IV database, which is exempt from IRB review and does not require informed consent.
Author Contributions
RG, SC, NB, RL, AC, KY, and AC contributed to data collection and model development. AM supervised the project, performed clinical validation, and led manuscript preparation. All authors reviewed and approved the final manuscript.
Data Availability
The data used in this study are available through the MIMIC-IV database, maintained by the Massachusetts Institute of Technology (MIT) Laboratory for Computational Physiology (https://physionet.org/content/mimiciv/). Access to the data requires completion of appropriate training and data use agreements. While the data are not publicly available in raw form due to licensing restrictions, they may be obtained from the authors upon reasonable request and with permission from the MIT Laboratory for Computational Physiology. Our team can provide our NLP code used to extract CTA cases and to extract each variable.
Abbreviations
BUN: blood urea nitrogen; CTA: computed tomography angiography; EHR: electronic health record; GI: gastrointestinal; IRB: institutional review board; ML: machine learning; ROC-AUC: area under the receiver operating characteristic curve; SMOTE: Synthetic Minority Oversampling Technique
| References | ▴Top |
- Kim BS, Li BT, Engel A, Samra JS, Clarke S, Norton ID, Li AE.
Diagnosis of gastrointestinal bleeding: a practical guide for clinicians.
World J Gastrointest Pathophysiol. 2014;5(4):467-478.
doi pubmed - Sengupta N, Kastenberg DM, Bruining DH, Latorre M, Leighton JA, Brook
OR, Wells ML, et al. The role of imaging for GI bleeding: ACG and SAR consensus recommendations.
Radiology. 2024;310(3):e232298.
doi pubmed - Alkhorayef M, Babikir E, Alrushoud A, Al-Mohammed H, Sulieman A.
Patient radiation biological risk in computed tomography angiography procedure.
Saudi J Biol Sci. 2017;24(2):235-240.
doi pubmed - Ramaswamy RS, Choi HW, Mouser HC, Narsinh KH, McCammack KC, Treesit
T, Kinney TB. Role of interventional radiology in the management of acute gastrointestinal
bleeding. World J Radiol. 2014;6(4):82-92.
doi pubmed - Kudu E, Danis F. The evolution of gastrointestinal bleeding: a
holistic investigation of global outputs with bibliometric analysis.
Turk J Gastroenterol. 2022;33(12):1012-1024.
doi pubmed - Johnson AEW, Bulgarelli L, Shen L, Gayles A, Shammout A, Horng S,
Pollard TJ, et al. MIMIC-IV, a freely accessible electronic health record dataset. Sci Data.
2023;10(1):1.
doi pubmed - Driessen GK, Heidtmann H, Schmid-Schonbein H. Effect of hemodilution
and hemoconcentration on red cell flow velocity in the capillaries of the rat mesentery.
Pflugers Arch. 1979;380(1):1-6.
doi pubmed - Shikdar S, Vashisht R, Zubair M, Bhattacharya PT. International
normalized ratio: assessment, monitoring, and clinical implications. In: StatPearls. Treasure
Island (FL) ineligible companies. 2025.
pubmed - Tomizawa M, Shinozaki F, Hasegawa R, Shirai Y, Motoyoshi Y, Sugiyama
T, Yamamoto S, et al. Patient characteristics with high or low blood urea nitrogen in upper
gastrointestinal bleeding. World J Gastroenterol. 2015;21(24):7500-7505.
doi pubmed - Lo PH, Huang YF, Chang CC, Yeh CC, Chang CY, Cherng YG, Chen TL, et
al. Risk and mortality of gastrointestinal hemorrhage in patients with thrombocytopenia: Two
nationwide retrospective cohort studies. Eur J Intern Med. 2016;27:86-90.
doi pubmed - Fred HL. Drawbacks and limitations of computed tomography: views from
a medical educator. Tex Heart Inst J. 2004;31(4):345-348.
pubmed - Hendee WR, Edwards FM. ALARA and an integrated approach to radiation
protection. Semin Nucl Med. 1986;16(2):142-150.
doi pubmed - Zhu J, Pu S, He J, Su D, Cai W, Xu X, Liu H. Processing imbalanced
medical data at the data level with assisted-reproduction data as an example. BioData Min.
2024;17(1):29.
doi pubmed - Gnip P, Vokorokos L, Drotar P. Selective oversampling approach for
strongly imbalanced data. PeerJ Comput Sci. 2021;7:e604.
doi pubmed
This
article is distributed under the terms of the Creative Commons Attribution 4.0 International
License (CC BY 4.0), which permits unrestricted use, distribution, and reproduction in any
medium, including commercial use, provided the original work is properly
cited.
AI in Clinical Medicine is published by Elmer Press Inc.