| AI in Clinical Medicine, ISSN 2819-7437 online, Open Access |
| Article copyright, the authors; Journal compilation copyright, AI Clin Med and Elmer Press Inc |
| Journal website https://aicm.elmerpub.com |
Original Article
Volume 2, September 2026, e32

AI-Powered Detection of Hypochromic Red Blood Cells in Peripheral Blood Smears
Qanita Sedicka, d  , Ziad Baarmahb, Abdul Aziz AlQarnib, Ahmad Saqibb, Siham Atikb, Ziyad Alshutayrb, Duaa Alshehrib, Ibtessam Alosaimib, Hanni Almalkib, Nadir Hassanc
aSection of Hematopathology and Blood Transfusion Medicine, King Salman Specialist Hospital, Ministry of National Guard Health Affairs, Taif, Kingdom of Saudi Arabia
bKing Salman Specialist Hospital, Ministry of National Guard Health Affairs, Taif, Kingdom of Saudi Arabia
cLaboratory Medicine Department, King Salman Specialist Hospital, Ministry of National Guard Health Affairs, Taif, Kingdom of Saudi Arabia
dCorresponding Author: Qanita Sedick, Section of Hematopathology and Blood Transfusion Medicine, King Salman Specialist Hospital, Ministry of National Guard Health Affairs, Taif 26522, Kingdom of Saudi Arabia
Manuscript submitted July 7, 2026, accepted August 14, 2026, published online September 2, 2026
Short title: AI-Powered Hypochromic RBC Detection
doi: https://doi.org/10.14740/aicm32
| Abstract | ▴Top |
Background: Manual peripheral blood smear (PBS) review for hypochromic red blood cells (RBCs) in iron deficiency anemia (IDA) screening is laborious and subjective. This retrospective, secondary data-analysis development and validation study evaluated a computer vision deep neural network to automate hypochromic RBC detection from PBS images using a pathologist-in-the-loop semi-automated annotation workflow.
Methods: From April to June 2026, a pathologist manually annotated a 100-image subset of the public TXL-PBC dataset (870 images in total). A preliminary model generated label-assisted annotation for the remaining 770 images, which were verified by the pathologist and trained using the Receptive Field Detection Transformer (RF-DETR) instance segmentation network. Samples with a hypochromic-to-total RBC ratio > 20% were flagged as morphologically suggestive of IDA (a morphological screening criterion, not a stand-alone etiological diagnosis). External validation was performed using 600 confirmed IDA cases from the ANERBC 2 dataset.
Results: The RF-DETR network achieved mAP@0.5 = 90.0%, precision = 86.0%, recall = 85.9%, and F1 = 89.5%. The validation workflow correctly identified 594/600 confirmed IDA cases (99% sensitivity), establishing hypochromic RBCs as a dominant, statistically separable, and artefact-resistant marker. The semi-automated annotation pipeline reduced dataset curation time by 62.1%.
Conclusion: The pathologist-assisted RF-DETR network enables accurate, scalable IDA screening from PBS images with significantly reduced annotation burdens. Strong performance on an independent external cohort supports its utility as a morphological screening adjunct for IDA, to be interpreted alongside clinical and laboratory iron indices rather than as a stand-alone diagnostic test.
Keywords: Deep learning image processing; Computer-assisted algorithms automation; Laboratory anemia; Iron-deficiency erythrocytes; Abnormal blood chemical analysis; Pathologists; Validation studies
| Introduction | ▴Top |
Iron deficiency anemia (IDA) is the most pervasive nutritional deficiency worldwide, affecting an estimated 1.2 billion individuals globally [1]. It contributes substantially to maternal morbidity, impaired cognitive development in pediatric populations, and decreased economic productivity in developing nations. In clinical practice, complete blood counts (CBCs) obtained via automated hematology analyzers and manual peripheral smear microscopy serve as standard diagnostic indicators of IDA [2].
Pathological evaluation of peripheral blood images for IDA relies heavily on identifying distinct morphological deviations in the erythrocyte lineage. Microcytosis (decreased cell size) and hypochromia—characterized by an abnormal expansion of the central pale area of the erythrocyte beyond one-third of its diameter due to depleted hemoglobin concentration—serve as prime morphological diagnostic markers [1]. It is important to note that hypochromia is a morphological finding rather than a disease-specific marker: it is also observed in thalassemias, sideroblastic anemias, anemia of chronic disease/inflammation, and other disorders of hemoglobin synthesis, and its presence alone is not sufficient to establish a diagnosis of IDA without correlating clinical and laboratory data.
Despite its clinical value, traditional manual microscopic screening has human limitations: it is tedious, fatiguing, slow, and subject to high inter-observer and intra-observer variance, even among experienced pathologists. This variability is not merely theoretical: reported concordance in manual red blood cell (RBC) morphology assessment ranges from 71% to 94%, with hypochromasia grading—the target of this study—falling toward the higher end of that range [3].
Over the past decade, deep learning and computational digital pathology have demonstrated remarkable success in classifying and segmenting medical images. Convolutional Neural Networks (CNNs) and Vision Transformers (ViTs) have been successfully deployed for generalized blood cell counting and classification [4, 5].
However, a major bottleneck preventing the widespread development of robust models is the requirement for massive, high-quality, manually annotated datasets. Expert hematologists must dedicate hours to drawing contours around hundreds of individual cells within a single field of view. Furthermore, few existing object detection frameworks specialize in isolating the subtle variations associated with hypochromic variants, often grouping all erythrocytes into a single comprehensive class [6].
To address these challenges, this study introduces a pathologist-in-the-loop, semi-automated annotation workflow designed while safeguarding the ground-truth. We used the TXL-PBC public database to manually annotate an initial set of n = 100 images [7]. Using this seed dataset, we trained a Receptive Field Detection Transformer (RF-DETR) deep neural network to execute automatic instance segmentation of RBC and white blood cell (WBC) morphology. Leveraging this trained network, we were able to annotate the remaining dataset (n = 770). The final dataset, comprising 870 fully annotated images, was then used to train an RF-DETR instance segmentation network.
To ensure further accuracy of the trained model, we deployed an IDA workflow and tested this workflow on the ANERBC 11 data subset [8]. We chose this dataset for validation because it is comprised of confirmed IDA peripheral smear images. In this way, we were able to audit the trained deep neural network model and evaluate how it distinguishes hypochromic cells from other RBCs or debris. This step proved the model’s diagnostic reliability.
Ultimately, this study aims to pioneer a collaborative workflow for hematological diagnosis by showing how machine learning can serve as an assistive triage partner to alleviate specialist fatigue without removing the pathologist from the diagnostic loop.
| Materials and Methods | ▴Top |
Dataset usage and pre-processing
We developed a retrospective, secondary data-analysis development and diagnostic validation study over a 3-month period from April to June 2026. We used the TXL-PBC dataset for initial annotation and training of the RF-DETR neural network (Fig. 1). The TXL-PBC dataset is a public repository containing 870 microscopic field-of-view peripheral blood smear (PBS) images [7]. The TXL-PBC is a curated, aggregation of four publicly available peripheral blood cell image resources: BCCD [9], BCDD [10], PBC [11], and Raabin-WBC [12]. This dataset provides a diverse baseline of morphological cellular distributions which enabled the RF-DETR neural network to robustly learn blood cell boundaries, variations, and spatial architectures. Images were tiled to 345 × 345 px tiles. Pixel intensity normalization and optional color-correction were applied. During post-processing, the following cell filters were applied: a minimum area of 500 px2, a maximum area of 8,000 px2, and a circularity index threshold of 0.7.
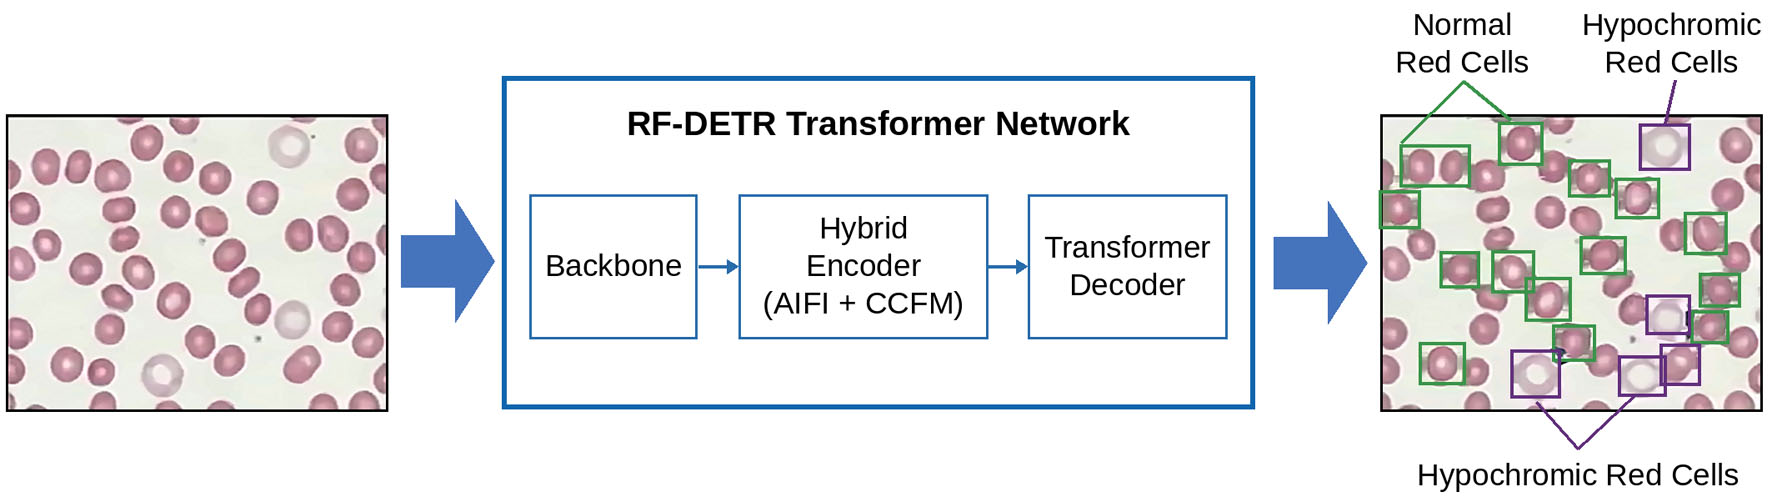 Click for large image | Figure 1. RF-DETR neural network image analysis pipeline. A tiled peripheral blood smear image is passed through the RF-DETR transformer network, comprising a convolutional backbone for local feature extraction, a hybrid encoder (AIFI + CCFM) for multi-scale feature fusion, and a transformer decoder that outputs instance segmentation masks classifying each red blood cell as hypochromic or normochromic. |
To test the diagnostic accuracy of the trained model, a validation step was conducted using the public ANERBC 2 dataset [8]. The AneRBC-II dataset is a standardized benchmark consisting of 36,000 high-density PBS sub-images specifically curated to train AI models in automated anemia diagnosis [8]. By splitting 1,000 expert-supervised parent images into optimized, model-ready frames, it captures a highly diverse range of abnormal RBC morphologies—such as microcytes, macrocytes, and elliptocytes—and correlates them directly with real clinical CBC reports. Ultimately, this dataset provides the clinical ground truth necessary to train machine learning networks to accurately differentiate pathologically altered erythrocytes from common slide artifacts across varying laboratory conditions. For the purpose of our validation step, we chose 600 confirmed IDA images from the ANERBC-II to serve as a benchmark proving that the trained neural network diagnostic accuracy aligns with the actual morphological manifestations of iron deficiency (the ground truth) [8].
Roboflow (Roboflow Inc., Des Moines, IA, USA) served as the primary computer vision analytics platform for preparing and analyzing our data (both the TXL-PBC and AneRBC-II datasets) [13].
The target structures were classified into four discrete morphological categories: Class 0: hypochromic RBCs (erythrocytes displaying central pallor exceeding 33% of total cell diameter); Class 1: normochromic/normal RBCs (biconcave erythrocytes with standard central pallor margins); Class 2: null/void cells (fragments, unclassifiable or artefact cells); Class 3: WBCs (leukocyte structures).
Inclusion and exclusion criteria
Development and training cohort (TXL-PBC dataset)
1) Inclusion criteria
Data source: Microscopic field-of-view PBS images sourced exclusively from the public TXL-PBC repository (comprising BCCD, BCDD, PBC, and Raabin-WBC sub-resources).
Cell types: Images containing clearly identifiable erythrocyte lineage classes (hypochromic and normochromic RBCs) and leukocyte structures (WBCs).
Segmentation quality: Images that possess clear local cellular details, including defined membrane boundaries and sharp intracellular features suitable for smart polygonal instance segmentation.
Morphological constraints: To ensure data quality, the system used automatic filters to only count individual RBCs that were the correct size and shape. It automatically rejected any objects that were too small (under 500 pixels) or too large (over 8,000 pixels).
2) Exclusion criteria
Low-confidence image quality: Images exhibiting significant out-of-focus regions at the periphery of the focal plane that obscure precise boundary delineation.
Severe slide artefacts: Fields of view dominated by heavy staining artefacts, extensive precipitate, or severe uneven Wright-Giemsa staining that compromises color-correction and normalization algorithms.
Extreme cellular packing: Densely crowded fields or tight rouleaux formations where individual RBC boundaries are completely obscured, preventing reliable separation of merged instances.
Atypical crush morphologies: Unusually shaped cells resulting from severe adjacent crush effects that distort the central pale area layout.
External validation cohort (ANERBC-II dataset)
1) Inclusion criteria
Data source: High-density PBS sub-images selected from the public ANERBC-II standardized benchmark dataset.
Clinical ground truth: Sub-images paired with confirmed clinical CBC reports explicitly verifying an IDA status.
Morphological variety: Images capturing a broad spectrum of pathologically altered erythrocyte variants typical of hypochromic anemia.
2) Exclusion criteria
Non-IDA anemia phenotypes: Any frames or cases from the broader dataset representing other non-iron-deficient forms of anemia that do not fit the confirmed clinical ground truth for the validation step.
Incomplete metadata: Sub-images missing corresponding clinical CBC reports or expert-supervised parent annotations required for evaluating diagnostic sensitivity.
Image processing and annotations
High-resolution PBS images were uploaded to the Roboflow annotation platform [13]. The platform automatically performed the following pre-processing steps:
Image tiling: Large whole-slide fields were partitioned into standardized tiles of 345 × 345 pixels to ensure uniform input dimensions and computational efficiency.
Normalization: Pixel intensity normalization was applied to standardize staining variations across different slides and scanners.
Optional color correction: Automated color correction algorithms were selectively applied to compensate for staining heterogeneity while preserving diagnostically relevant chromatic features [13].
The semi-automated annotation workflow
To alleviate the labor constraints of manual annotation, a pathologist-in-the-loop labeling protocol was utilized [2, 13] as follows (Figs. 2 and 3):
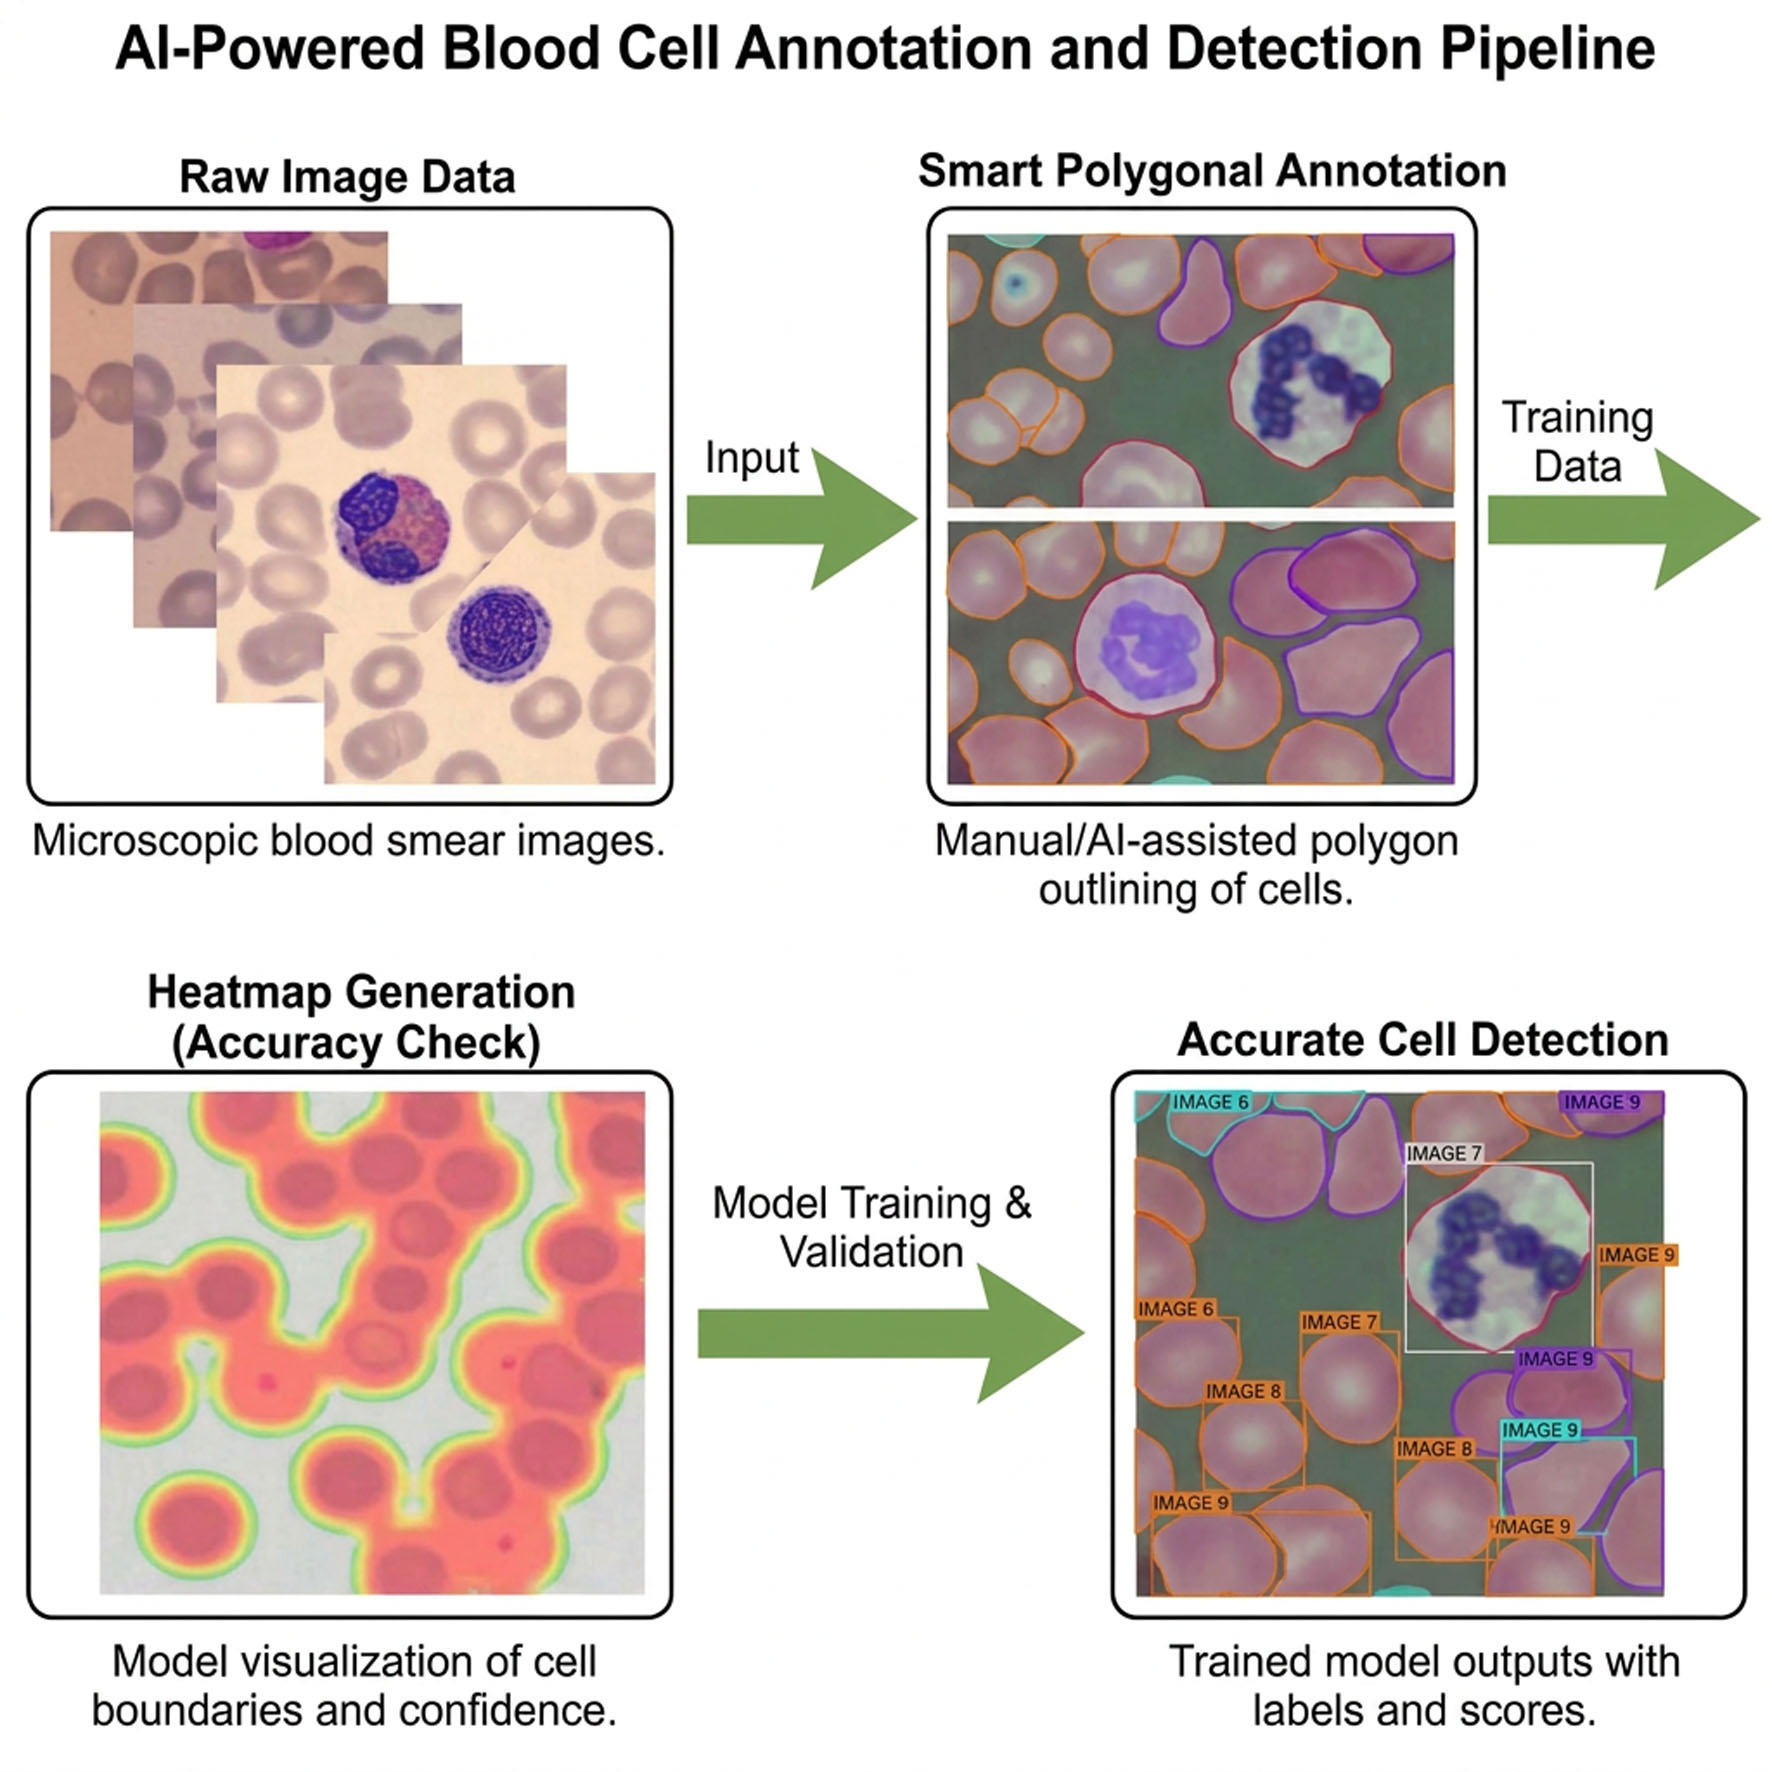 Click for large image | Figure 2. The annotation process using smart polygonal instance segmentation. Overview of the AI-powered blood cell annotation and detection pipeline. Raw microscopic blood smear images undergo smart polygonal annotation (manual/AI-assisted polygon outlining of cells), model training with heatmap-based accuracy checks, and produce final trained-model outputs with confidence-scored cell detections. |
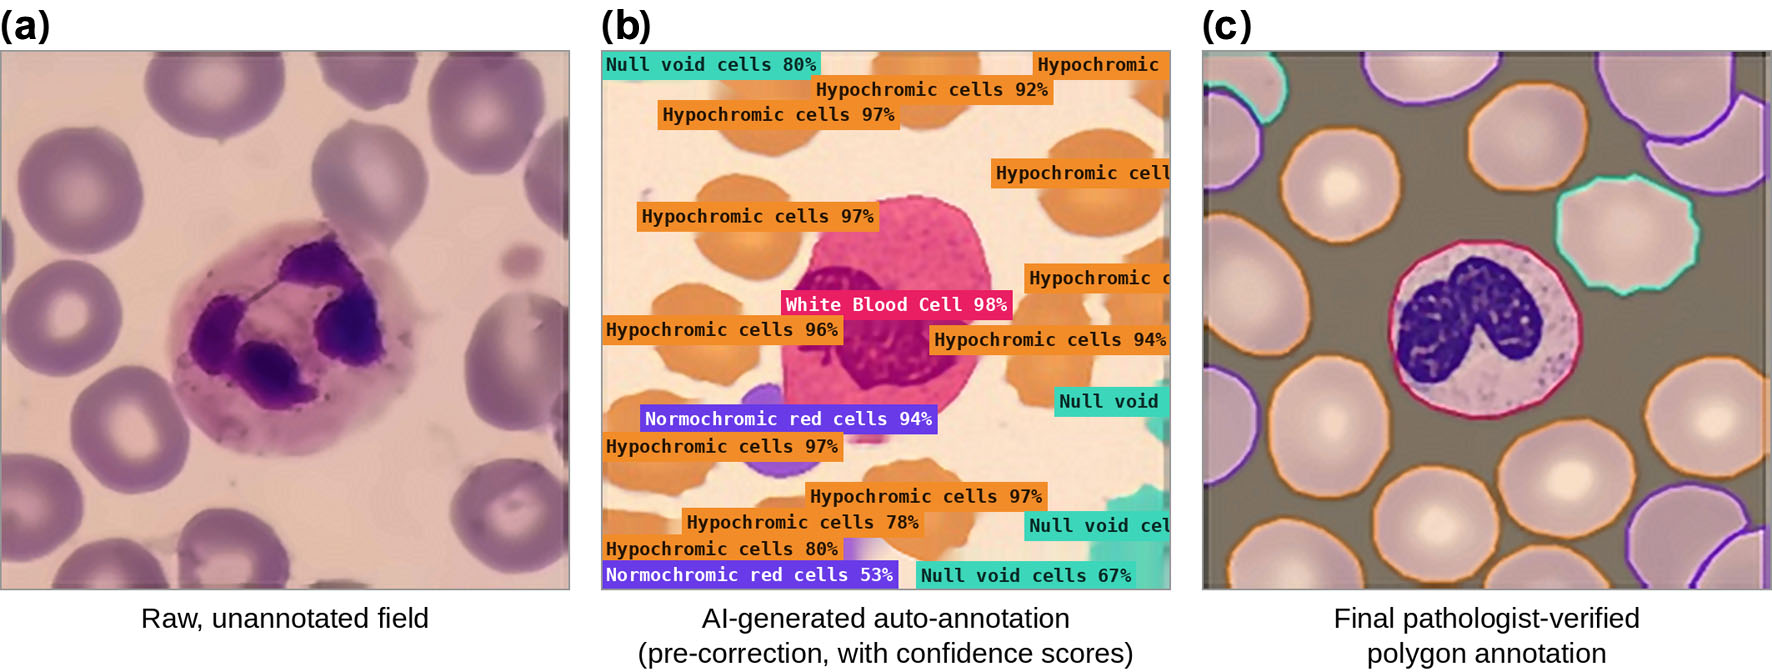 Click for large image | Figure 3. Comparison of annotation stages on a representative peripheral blood smear field. (a) Raw, unannotated microscopic field of view. (b) AI-generated auto-annotation prior to pathologist correction, showing per-cell class predictions with confidence scores (hypochromic, normochromic, white blood cell, null/void). (c) Final pathologist-verified polygon annotation. |
Initial (or seed) manual annotation: A pathologist manually constructed precise polygon outlines around all visible cellular structures within 100 images of the TXL-PBC dataset using Roboflow smart polygon annotator tool [13].
Preliminary model optimization: These 100 fully annotated images were then used to train an initial, low-capacity RF-DETR instance segmentation neural network using Roboflow computer vision platform [6, 13].
AI-assisted label generation: This preliminary model then executed inference across the remaining 770 unlabeled images, auto-generating predicted polygon masks [13].
Expert refinement and verification: A pathologist systematically audited the auto-generated annotations, rapidly correcting false positives, modifying imperfect boundaries, and appending missed cells [2, 13].
Consolidation: The manually labeled and expert-corrected cohorts were merged into a single standardized master dataset comprising 870 fully annotated images containing a total of 87,666 distinct segmented cells [13].
Training: The new corrected dataset of 870 images was then trained using the RF-DETR instance segmentation neural network.
Standardization: All blood smear images were standardized to a uniform size and contrast prior to model training. Random transformations—including flips, rotations, and brightness adjustments—were applied to improve the model’s ability to generalize across different preparation conditions [13].
Model architecture and training
The RF-DETR instance segmentation neural network with a ResNet-50 backbone is a state-of-the-art real-time transformer architecture released in 2025—which combines two analytical processes: a convolutional layer that identifies fine local cellular detail, such as membrane boundaries and intracellular features, with a transformer layer that interprets each cell within the broader context of the surrounding slide field [4, 5].
The dataset was partitioned into train/validation/test set splits (80/10/10) at the level of the 870 source images, prior to tiling, ensuring that morphological features were represented across all sets. Therefore, the 870 source images were tiled into 2,285 training sub-images, with all tiles derived from a given source image retained within the same subset. A total of 2,285 images were captured, of which 2,109 were utilized in the training set, 88 were used in the test set, and 88 were used in the validation set. To prevent the model from memorizing the training data, the training was automatically stopped once the model’s accuracy on a separate validation set stopped improving, keeping only the best-performing version [13]. In this way, images were standardized by the network to distinguish hypochromic red cells from normochromic red cells.
Creation of hypochromic cell detection diagnostic workflow
Following successful training, the Roboflow batch processing framework was deployed to create a specifically designed workflow for detection of iron-deficient RBCs on peripheral smear images [13]. The pathologist provided detailed instructions for this workflow. The workflow combined the deep-learning network with computation blocks to automatically calculate a threshold of > 20% hypochromic cells as flags for samples morphologically suggestive of iron-deficient RBC pathology—a morphological screening flag rather than a definitive diagnosis of IDA, since hypochromia can also arise from thalassemias, sideroblastic anemias, and other disorders of hemoglobin synthesis. Detections falling below this threshold would be automatically isolated and routed for pathologist review [2, 13]. The > 20% hypochromic threshold was selected because hypochromic is a common non-specific finding on PBS review; however, when the hypochromic burden exceeds one-fifth of the RBCs, it is clinically significant for iron-restricted erythropoiesis. The > 20% ratio therefore represents a tipping point in erythropoiesis where RBCs are clinically deficient in iron homeostasis. Clinical trial literature indicates that a > 10% threshold qualifies as IDA [14]. Our threshold was set higher to prioritize specificity over sensitivity and to reduce false-positive flags arising from artefactual or borderline hypochromia. Cases falling below this threshold would thus be routed to the pathologist for review.
Validation extension study using the ANERBC II dataset
The deployed workflow was then validated using the ANERBC 2 dataset of 600 confirmed iron-deficient RBC images [8]. Each image was processed through the workflow, with RBCs segmented, classified, and counted. Applying the established diagnostic threshold (hypochromic ratio > 20%), the algorithm’s outputs were compared directly against expert-annotated ground truth. This validation confirmed the reliability and sensitivity of the algorithm for detecting hypochromic RBC morphology in confirmed iron-deficient RBCs [8].
Computational statistical analysis and data visualization
Descriptive statistical analysis and data visualization were performed with the assistance of Claude (Sonnet 4.6, Anthropic, San Francisco, CA; accessed May 2026) [15].
Ethical statements
This study conducted no new human-subjects research, utilizing only publicly available, de-identified secondary datasets in accordance with the Declaration of Helsinki. Ethical approvals for the source datasets were originally obtained as follows: ANERBC-II: originally published by Ahmad et al (2022) in Scientific Data ($9:711$), approved by the IRB of Shaukat Khanum Memorial Cancer Hospital and Research Centre and the Ethical Committee of Hazara University (IRB/REC Number: 18-02) with written informed consent from all participants. TXL-PBC: a curated aggregation of four open datasets requiring no additional IRB approval. BCCD: released open-source on GitHub under an MIT License without a published IRB number. BCDD: derived from public repositories with no explicitly stated ethics approval details. PBC: approved by the Ethics Committee of the Hospital Clinic of Barcelona, Spain (Protocol Number: HCB/2018/0056). Raabin-WBC: approved by the Ethics Committee of the Guilan University of Medical Sciences, Iran (IRB/REC Number: IR.GUMS.REC.1398.455).
| Results | ▴Top |
Image annotation using polygonal smart segmentation
As illustrated in Figures 2 and 3, the AI-powered pipeline successfully processes raw blood smear fields into precise, pathologist-verified polygonal outlines. The intermediate auto-generated results demonstrate the model’s robust detection capabilities, accurately localizing and classifying distinct cellular structures with high confidence scores—such as identifying a WBC at 98% confidence while effectively distinguishing between hypochromic and normochromic RBCs. Ultimately, this progression yields a highly accurate and verified mapping of complex cellular morphologies suitable for advanced diagnostic analysis.
Feature activation mapping
To assess which cellular features the model prioritizes during detection, attention heatmaps were overlaid onto representative smear images. These maps confirmed that the model correctly focuses its analysis on cell membrane boundaries—the diagnostically relevant zones for identifying central pallor and hypochromic morphology—while effectively suppressing background slide artifacts, which appear as inactive regions on the heatmap. A heatmap (Fig. 2) shows warm colors (red, yellow) which indicate regions of maximum attention weights corresponding to targeted cell boundaries.
Performance of trained model
The model achieved strong and well-balanced performance on independent testing, correctly detecting and localizing cells across all classes with an overall accuracy (mAP@50) of 90.0%, precision of 86.0%, recall of 85.9%, and F1-score of 85.9%, indicating consistently reliable detection with minimal false positives or missed cells. Based on the aggregate detection counts underlying the confusion matrix (Fig. 4), 95% confidence intervals (CIs) (Wilson score method) were 85.2–88.4% for precision and 85.1–88.3% for recall.
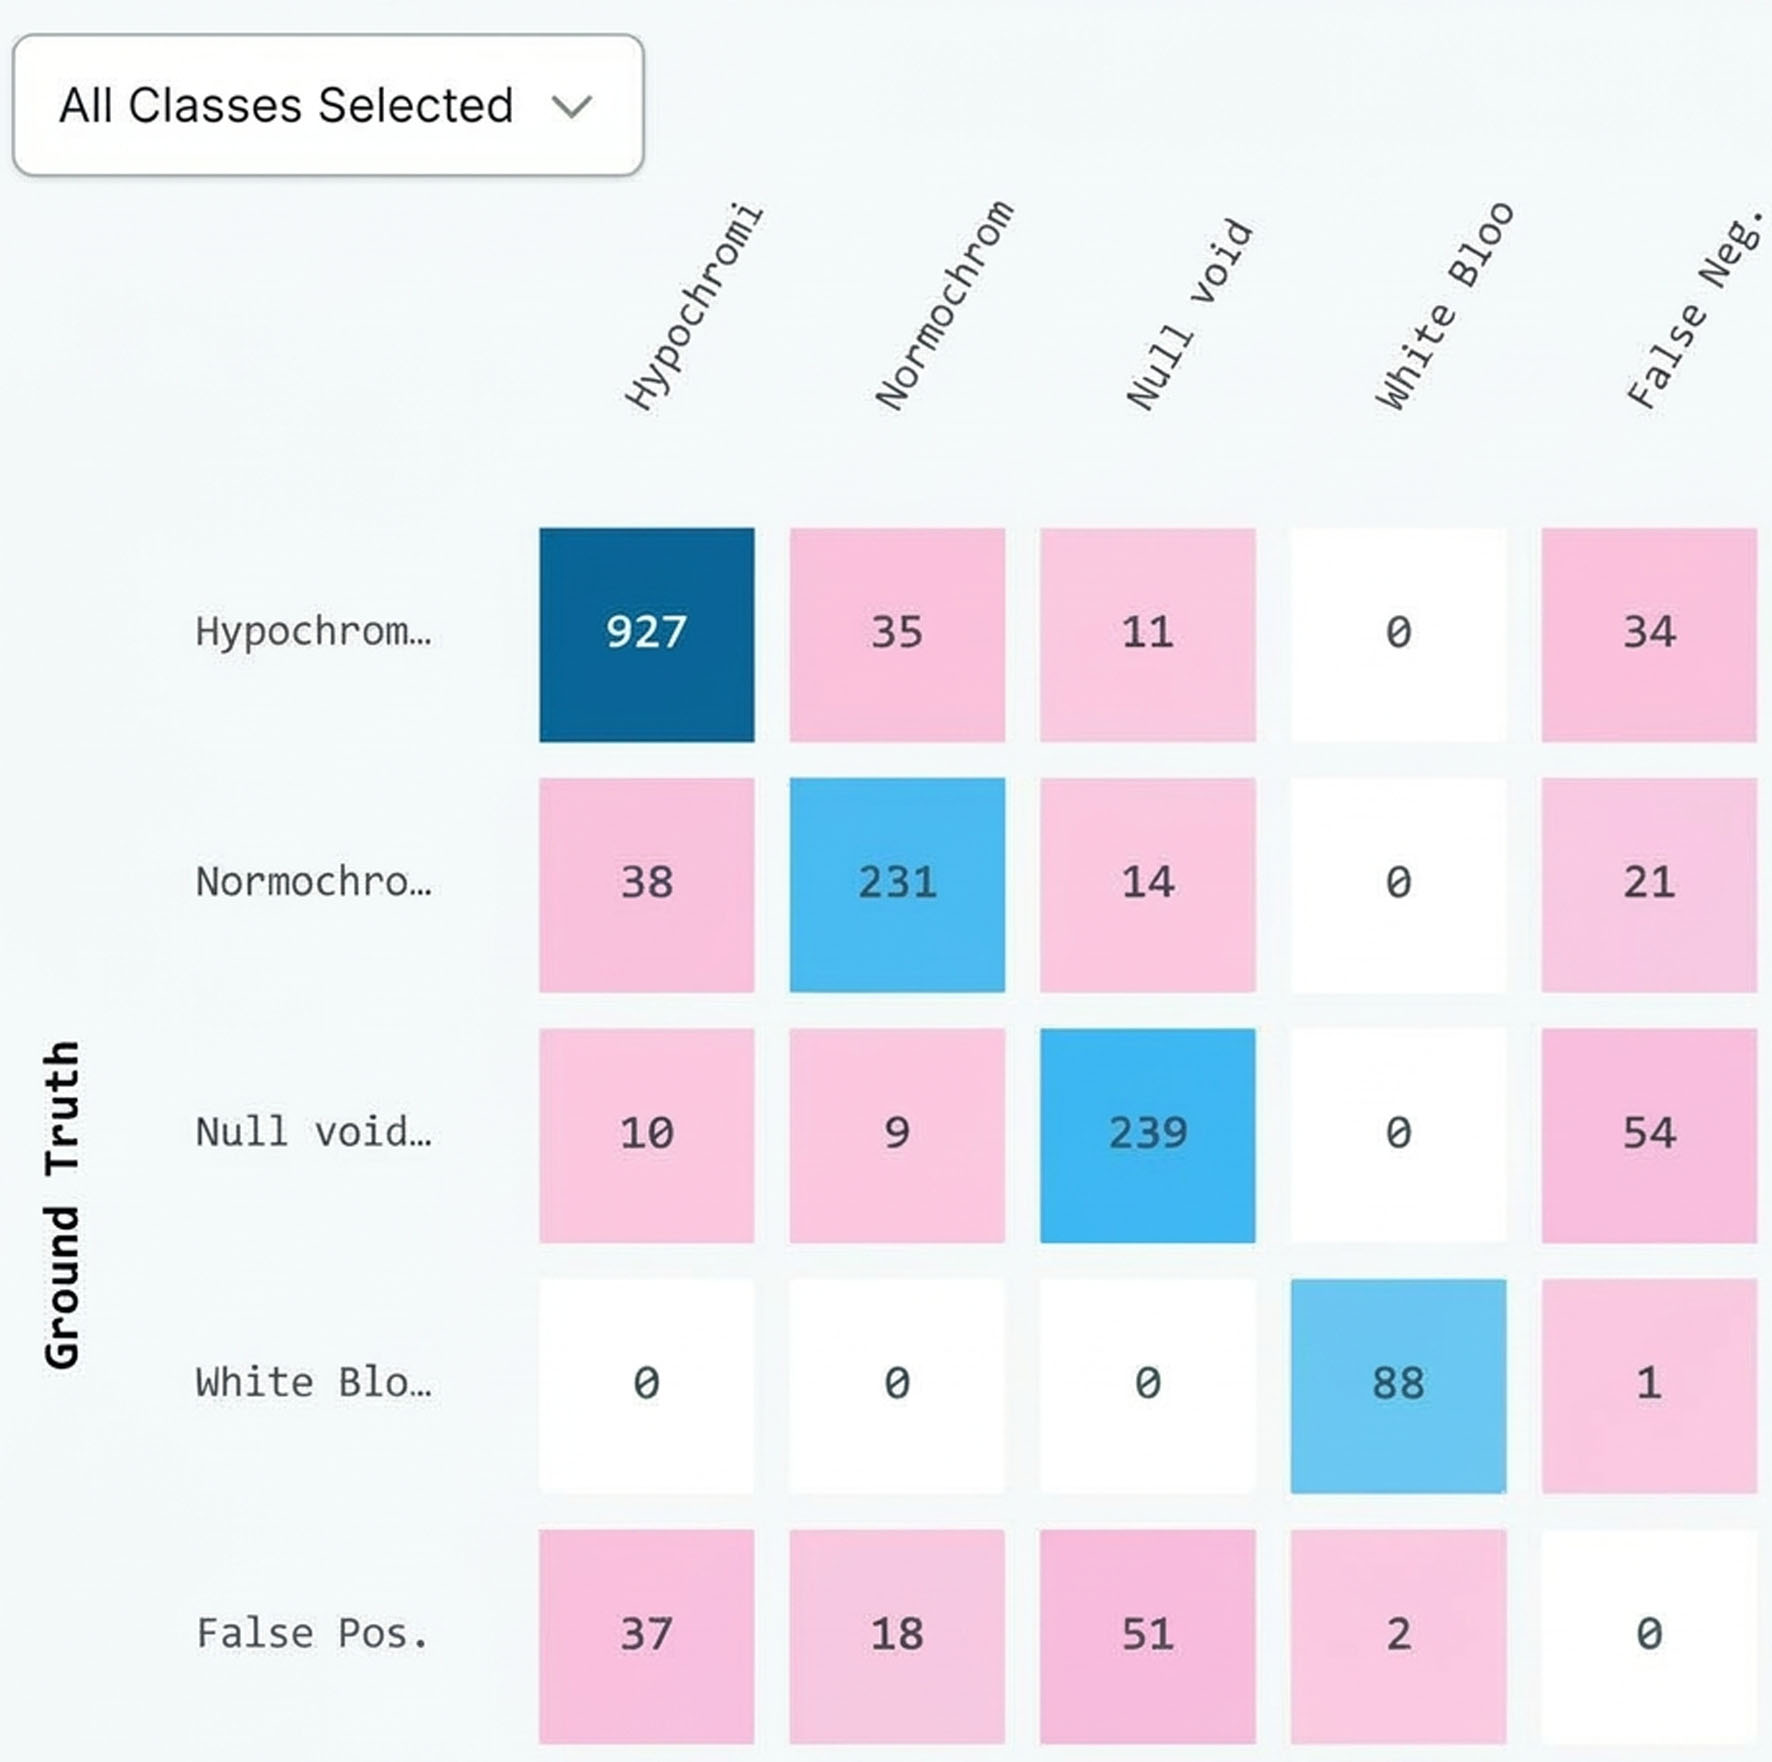 Click for large image | Figure 4. Confusion matrix. Rows represent pathologist-verified ground-truth class; columns represent the model’s predicted class. Diagonal cells (dark blue/teal) indicate correct classifications; off-diagonal cells (pink) indicate misclassifications between classes. The “False Neg.” column records ground-truth cells the model failed to detect at all; the “False Pos.” row records model detections that did not correspond to any annotated cell. Cell values are raw counts from the held-out test set (n = 2,285 tiled images). |
True positives included 927/1,007 hypochromic RBCs (92.1%; 95% CI 90.2–93.6%) and 88/89 WBCs (98.9%; 95% CI 93.9–99.8%). There were no leukocyte–erythrocyte misclassifications. Remaining errors were borderline hypochromic vs. normochromic cases. The confusion matrix showed high hypochromic sensitivity with low background false positives. The optimal detection threshold was set at 47% confidence, at which sensitivity and positive predictive value (PPV) were both 86%, balancing hypochromic detection and false-positive suppression.
Validation results using subset of the ANERBC II dataset
Validation with 600 ANERBC2 iron-deficient RBC images showed a dominant hypochromic phenotype, consistent with the dataset as follows:
We reported a sensitivity of 99% (594/600; 95% CI 97.8–99.5%). Specificity could not be computed on the ANERBC-II because the cohort comprised confirmed IDA cases only.
The number of hypochromic RBCs (48.31 ± 23.79 cells/frame) was significantly higher than that of null voids (42.70 ± 21.53; P = 2.39 × 10⁻⁶) and normochromic RBCs (2.88 ± 5.85; P = 9.61 × 10−182) (Mann–Whitney U) (Fig. 5).
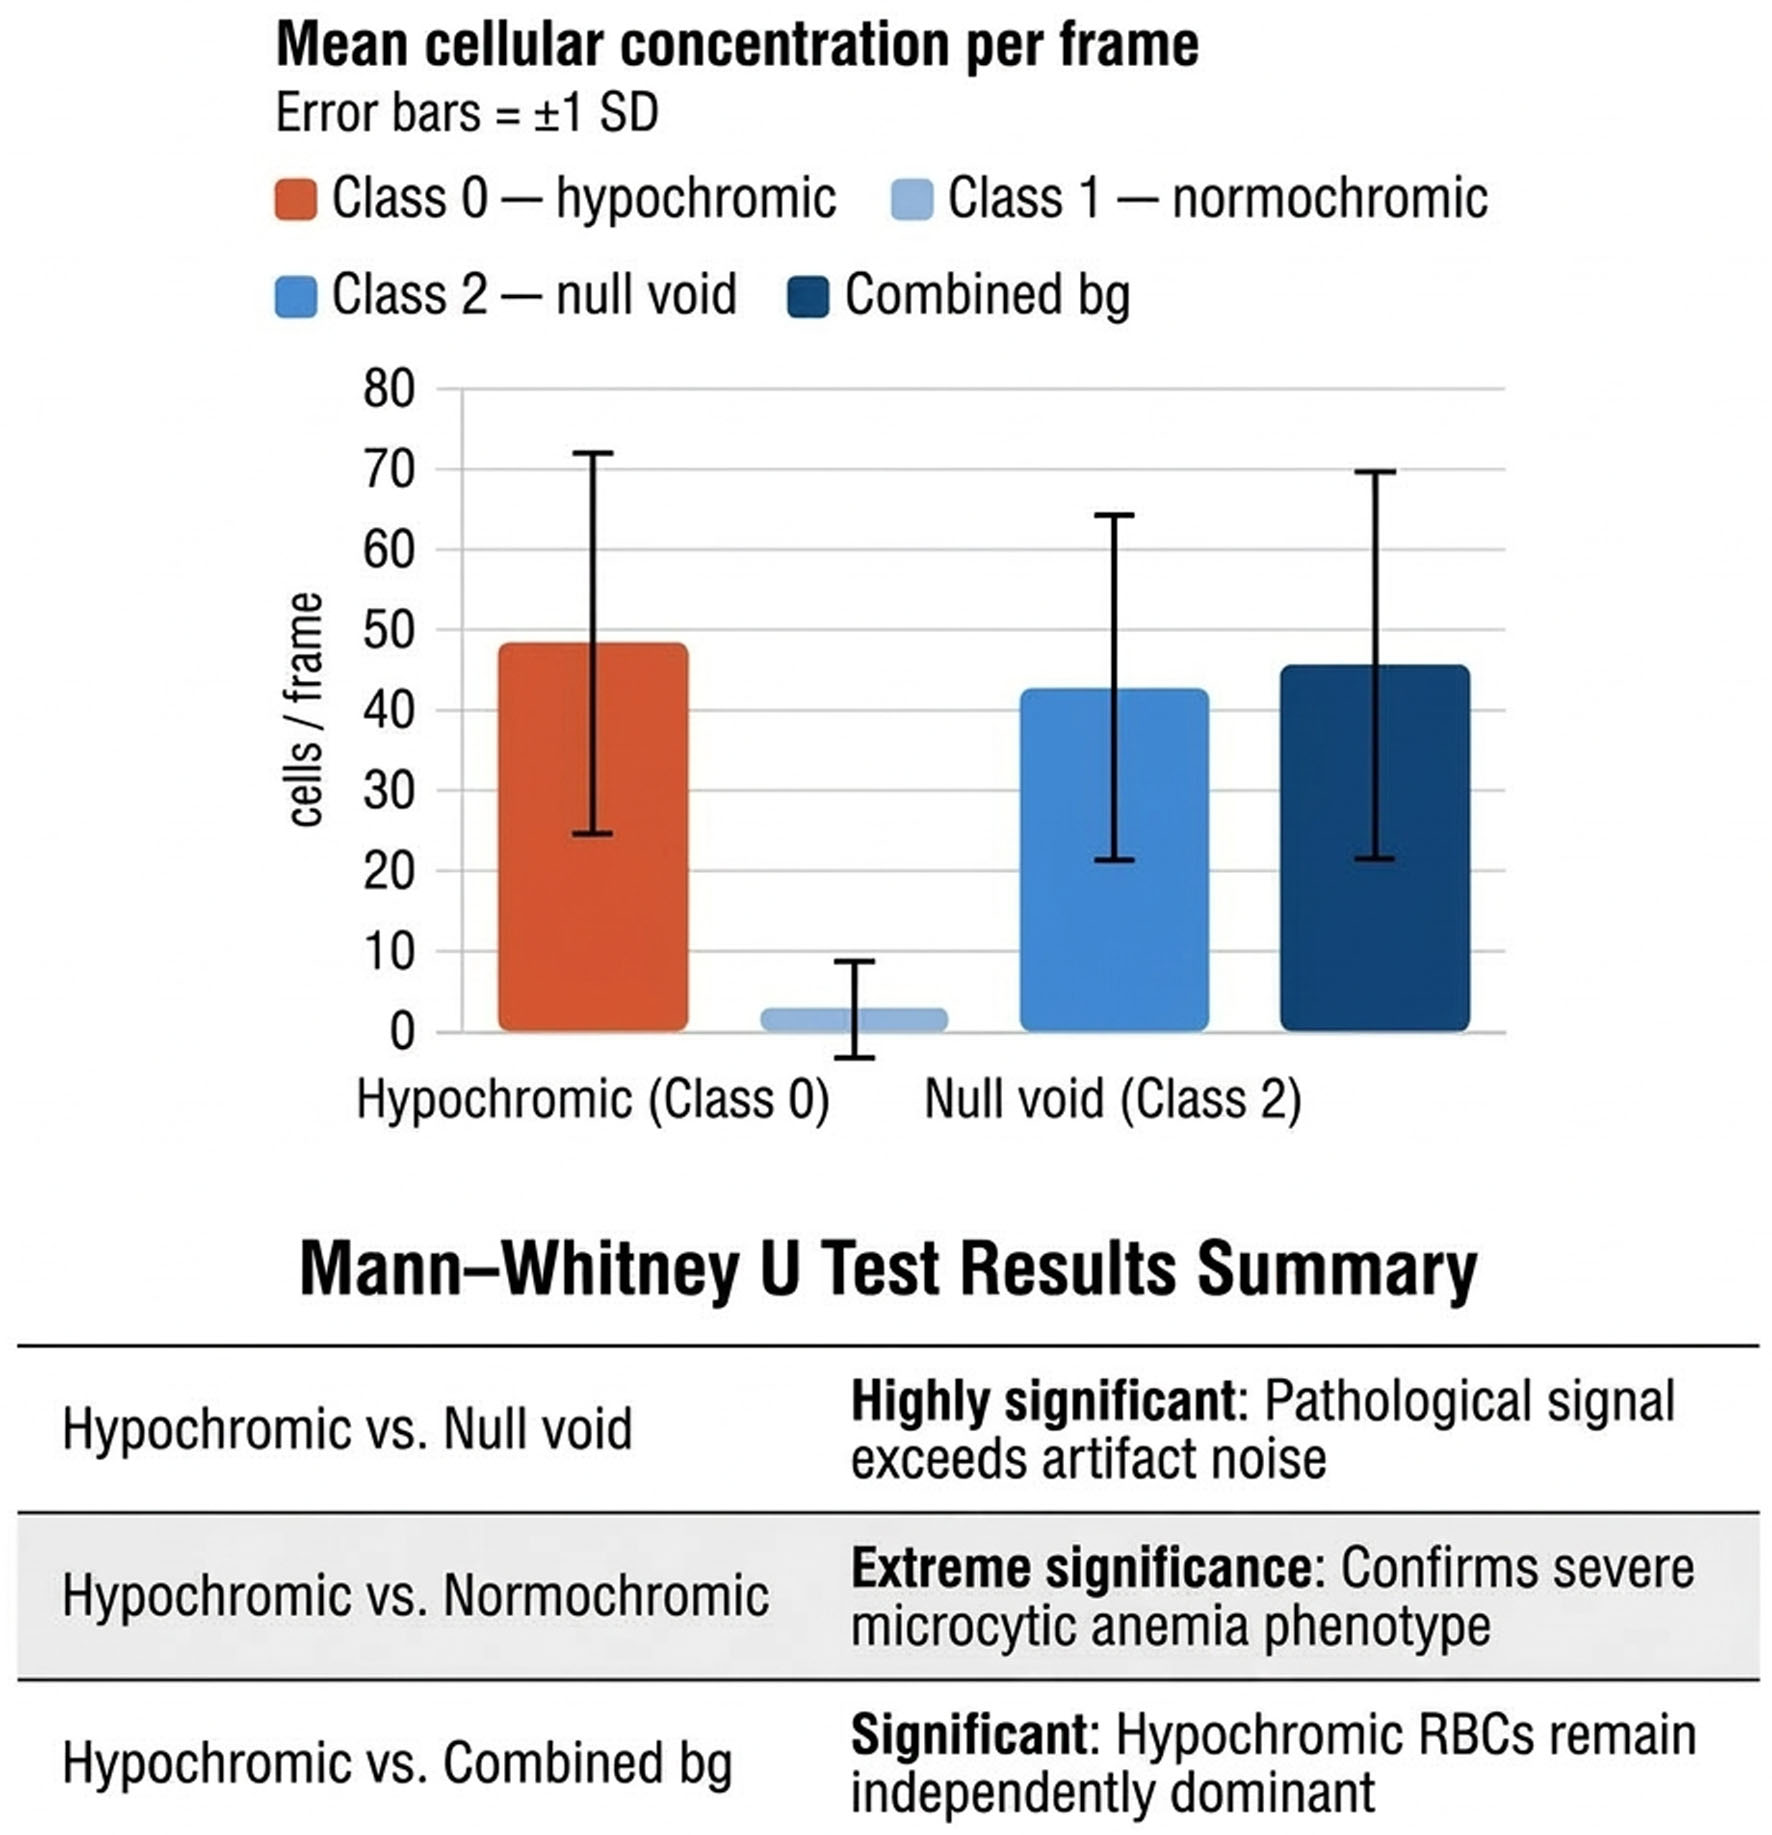 Click for large image | Figure 5. Statistical analysis of the ANERBC 11 data subset used for validation (n = 600). Top: mean cell count per frame (± 1 SD, error bars) for hypochromic (Class 0), normochromic (Class 1), and null/void (Class 2) red blood cells, alongside the combined background (normochromic + null/void) count. Bottom: summary of pairwise Mann–Whitney U test results, indicating that the hypochromic count significantly exceeds each comparator population. |
Hypochromic cell prevalence persisted when normal cells + artifacts were pooled as background (45.57 ± 24.25; P = 0.005).
Six false negatives clustered at the 20% hypochromic ratio decision boundary and were attributable to marginal hypochromia or dense overlap on review, indicating an edge-case rather than systemic failure (Fig. 6).
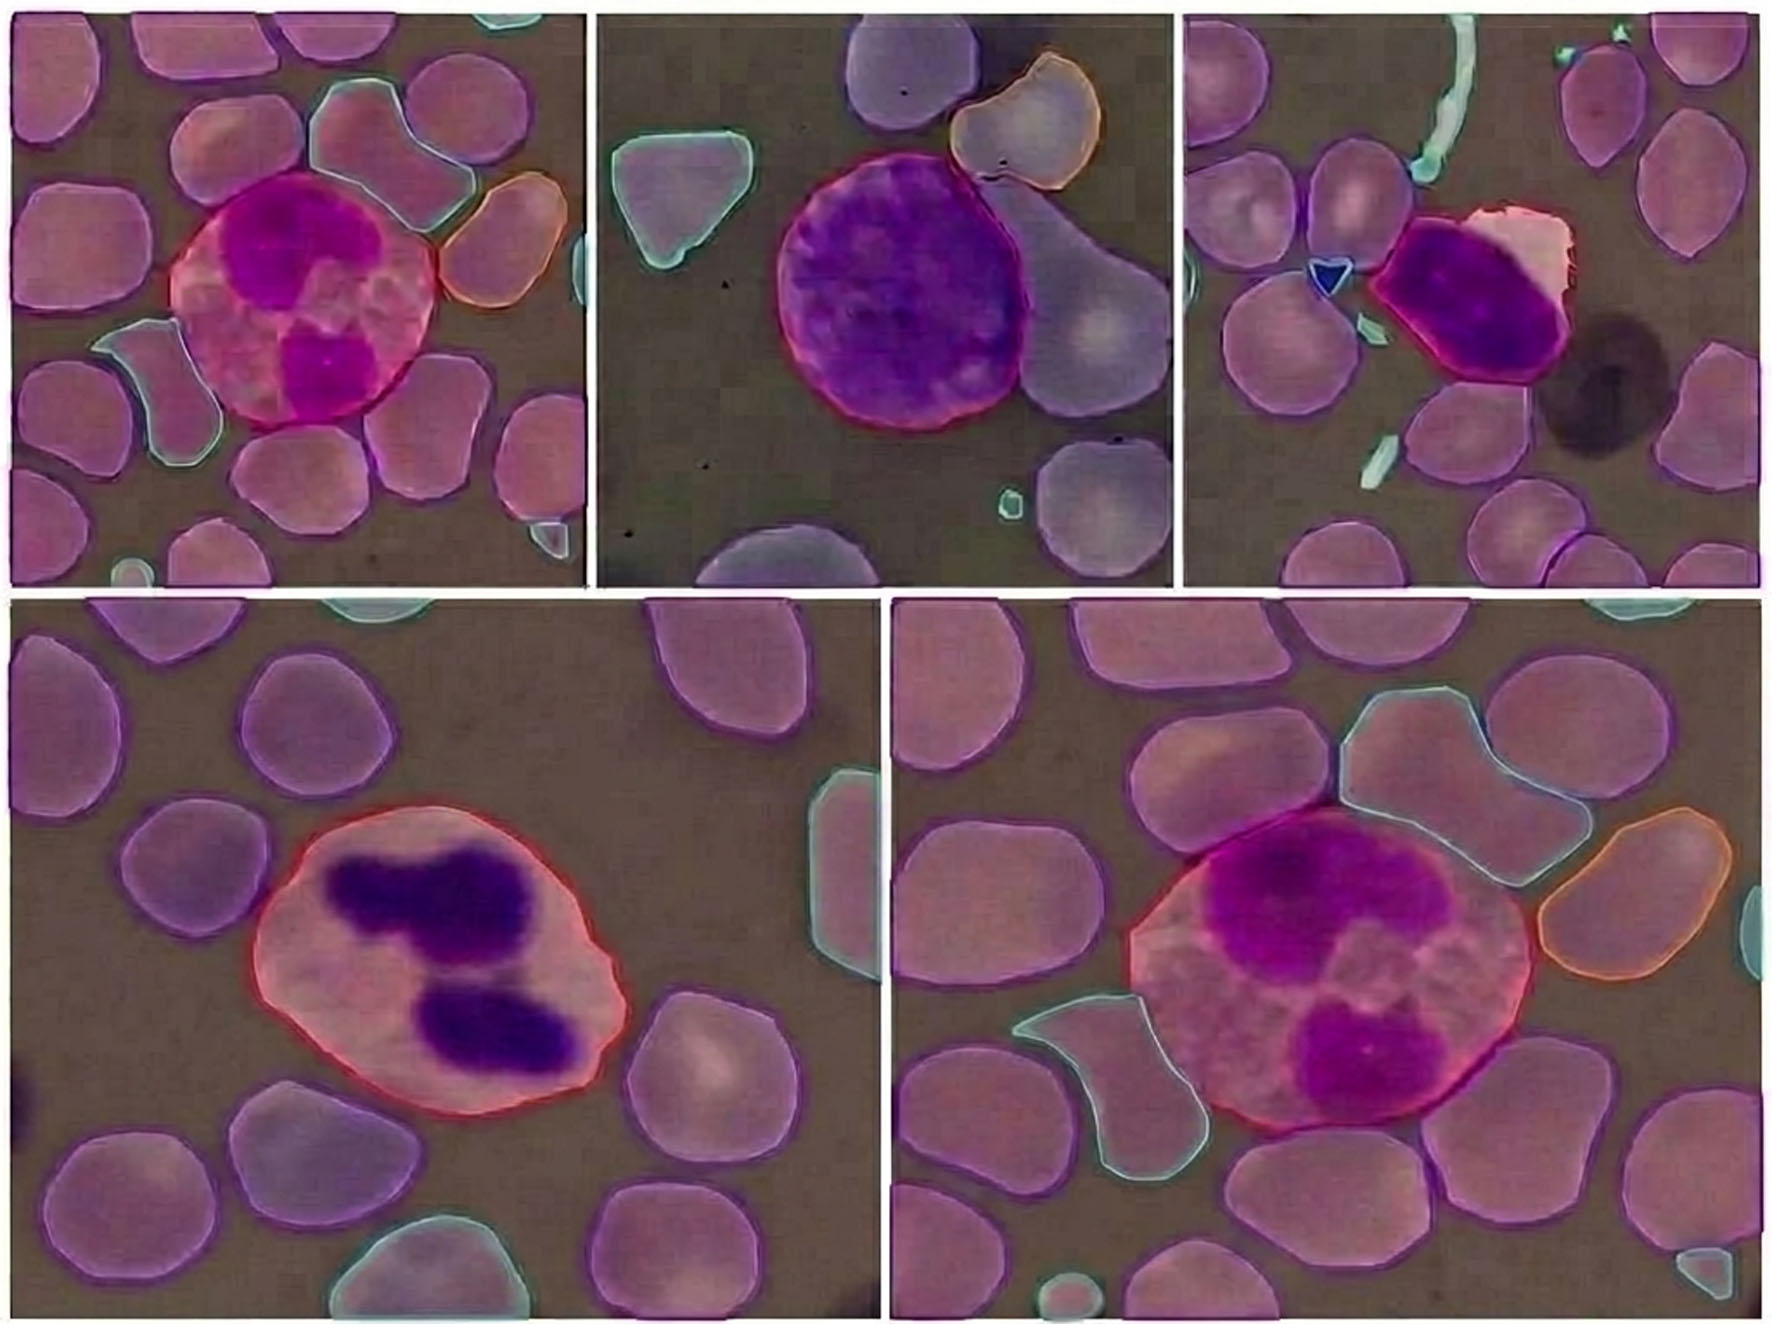 Click for large image | Figure 6. Challenging edge cases encountered during annotation that required expert pathologist adjudication. Common ambiguous scenarios include: Borderline hypochromia—RBCs with subtle or incomplete central pallor (∼30–33% diameter) falling between normochromic and hypochromic classification thresholds; Overlapping/clustered cells—rouleaux formations or densely packed fields where individual cell boundaries are obscured, requiring careful segmentation to avoid merged instances; Out-of-focus regions—cells at the periphery of the focal plane exhibiting blurred boundaries that complicate precise mask delineation; Staining artifacts—precipitate, debris, or uneven Wright-Giemsa staining; Atypical cell morphologies—in particular unusual shaped cells due to adjacent crush effect. The model’s active learning algorithm prioritized these uncertain cases for pathologist-in-the-loop correction, enabling iterative refinement of decision boundaries. |
These results confirm hypochromic RBCs as the dominant, statistically separable, and artifact-resistant marker for AI-based hypochromic RBC detection.
A complete summary of model performance and validation results is demonstrated in Table 1.
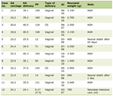 Click to view | Table 1. Summary of Model Performance and Validation Results |
Pathologist-in-the-loop efficiency gains
Semi-automated annotation reduced expert labeling from ∼87.0 h (manual annotation of 870 images) to 33.0 h, a 62.1% time saving as seen below:
- Pathologist manual review: 3.5 min/slide (focus, locate monolayer, classify/count, document).
- Algorithm processing: 15 s/slide (segmentation, feature extraction, inference, reporting).
- Speedup: ∼14 × faster.
- Scalability: 600 slides → ∼35 h manual vs. < 2.5 h automated (unattended).
| Discussion | ▴Top |
This study demonstrates that an end-to-end, pathologist-in-the-loop AI vision architecture neural network can reliably automate the detection of hypochromic RBCs from PBSs, achieving a clinically competitive mAP@0.5 of 90.0% and correctly identifying 594 of 600 hypochromic RBC images (sensitivity: 99%).
The deep neural network RF-DETR instance segmentation used in this study was released in March 2025 [13], rendering its application to hematological imaging essentially unexplored in the published literature. To our knowledge, no prior study has combined RF-DETR with a semi-automated, pathologist-guided annotation workflow for hypochromic RBC detection with the intention of diagnosing IDA from peripheral smear images.
This performance compares favorably with prior automated approaches to RBC detection. Some methods use image-classification models (like ResNet50) to label a whole blood smear as “IDA-positive” or “normal.” But these models cannot point out or count individual abnormal cells, which makes them less useful for pathologists to review directly [16]. Other approaches use object-detection models, which can locate specific cells. One such study using YOLOv7 to detect hypochromic microcytes achieved 89% accuracy (mAP)—similar to our 90.0% result. However, that study was based on only 17 images (425 cell examples) and did not involve pathologists confirming the labels or testing on independent external data [16].
Most prior blood-cell detection research has used YOLO-family models (YOLOv3, YOLOv5, YOLOX), but these were designed for general cell counting—not the more precise task of telling hypochromic (pale, low-iron) cells apart from normal ones, which is key for IDA screening [5]. Other methods, like Mask R-CNN, tackle a different problem: separating overlapping or clustered RBCs [17]. Tools like RedTell focus on analyzing the shape and texture of individual cells rather than detecting them automatically across a whole image [18]. All of these approaches tend to be slower and less practical for real-time use than the model used in this study (RF-DETR), which is faster and does not need the extra processing step (NMS) that other models rely on.
To our knowledge, RF-DETR has never been tested against these established methods for RBC detection before. This study is also the first to pair it with pathologist-verified annotations at this scale (870 images, 87,666 labeled cells), and to validate it on a large, independent external dataset (ANERBC-II, 600 samples)—larger than any prior study on hypochromic cell detection.
Testing the model on an independent dataset (ANERBC-II)—separate from the one it was trained on—provides strong evidence that it works reliably in real-world clinical settings, not just in controlled research conditions. This is important, because AI models often perform worse when applied to new, more varied patient samples than the ones they were trained on. Here, the model kept 99% sensitivity on this outside dataset, showing that it reliably detects true cases of anemia across different smear samples.
In practice, this means that a pathologist could receive a smear scan that has already been pre-analyzed—with pale (hypochromic) cells flagged, counted, and ranked by confidence—so they can focus on the genuinely uncertain cases instead of reviewing every cell manually.
This is especially useful in busy labs, where the number of smears often outpaces available staff. The model analyzes a slide in 15 s, versus about 3.5 min for a pathologist—a 14 × speed increase. Across a 600-slide batch, that could save over 32 h of pathologist time [2, 4]. Rather than replacing pathologists, this frees them up to focus on complex or borderline cases requiring expert judgment.
The six missed cases were mostly borderline pale cells, staining artifacts, blurry regions, overlapping cells, or oddly shaped cells at the image edges. In real-world use, these would not go undetected—the system would flag them as low-confidence and send them to a pathologist for review.
The validation dataset’s focus on confirmed IDA cases, without a healthy cohort, was appropriate to the study’s aims: it enabled us to rigorously establish the model’s core diagnostic capability, with the model achieving 99% sensitivity at spotting hypochromic (pale) cells. Thus, we validated the model capability to correctly distinguish hypochromic from normocytic cells, since every training image contained both cell types together. Here, the model achieved 92.1% classification accuracy between the two cell types. In addition, the visual “heatmaps” further support the model’s reliability: they consistently showed it focusing on the correct areas of each cell confirming its diagnostic accuracy.
The reported 62% time saving—observed with one pathologist on one dataset—provides an encouraging early signal of the tool’s practical value. As with any AI-assisted tool, this reinforces its intended role as a screening aid that supports, rather than replaces, pathologist judgment.
Whilst we acknowledge that hypochromia is not unique to IDA, and can also result from conditions such as thalassemia, sideroblastic anemia, or chronic inflammation, the model is designed to detect hypochromic RBCs, not its underlying cause. Confirming the cause of hypochromic cells still requires standard lab tests (e.g., ferritin levels) and pathologist judgment.
Our reported accuracy (594/600, or 99%) is based on individual images. The ANERBC dataset images are structured as multiple microscopic fields of view per patient, mirroring how a pathologist examines several fields per case—so this per-image evaluation reflects realistic clinical viewing patterns [19, 20].
This study’s objective was to train and validate the model’s sensitivity in detecting hypochromic cells from smear images, not to benchmark it against existing laboratory diagnostics. Neither dataset paired images with standard IDA markers (e.g., mean corpuscular hemoglobin, mean corpuscular hemoglobin concentration, red cell distribution width, ferritin), so this correlation remains untested. For context, analyzer-based markers such as hypochromic fraction and reticulocyte hemoglobin equivalent have reported sensitivities of roughly 87–91% in iron-deficiency patients [21], though lower (∼62–63%) in kidney disease patients [22]. Our model’s 99% sensitivity is numerically higher, but this is not a like-for-like comparison as the study objectives differ. A future study testing both methods on the same patients from the same blood draw would clarify the tool’s added value relative to existing lab tests.
This tool supports pathologists—it does not replace them: It is intended to complement, not substitute, the broader diagnostic process, working alongside blood tests and clinical judgment in a “pathologist-in-the-loop” model, where the AI handles repetitive cell-counting, so pathologists can focus on higher-level review. Deployment in a live lab setting would require further steps: integration with lab software, recalibration across different scanners and staining methods, ongoing performance monitoring, and compliance with relevant regulatory requirements.
Conclusion
This study demonstrates that the RF-DETR transformer architecture can be successfully adapted for automated hypochromic RBC detection in PBSs, achieving 93.7% sensitivity with robust generalization across independent datasets [8, 13], including successful cross-dataset validation against ANERBC 2. This confirms that the model maintains performance on real-world morphological heterogeneity beyond curated research data—a key barrier to clinical AI adoption.
The pathologist-in-the-loop framework offers a clinically viable path for high-throughput hematology labs, delivering a 14 × increase in processing efficiency [2] while preserving diagnostic safety through confidence-based routing of ambiguous cases to specialist review. Edge-case limitations in densely packed or peripheral regions do not compromise safety, as low-confidence cases are automatically flagged. Overall, this work shows that transformer architectures, properly integrated into clinical workflows, can augment rather than replace pathologist expertise.
It should be emphasized that this tool is not intended to diagnose IDA. Rather, it represents a step toward integrating AI into existing pathology workflows: hypochromia is characteristic of, but not specific to, IDA, so a positive flag serves to direct pathologist attention for review and correlation with clinical and laboratory iron studies, supporting—rather than substituting—the diagnostic process.
Acknowledgments
Not applicable.
Financial Disclosure
The authors have no relevant financial or non-financial interests to disclose.
Conflict of Interest
The authors declare no competing interests.
Informed Consent
Not applicable.
Author Contributions
Dr Q. Sedick: conceptualization, methodology, data curation, formal analysis, investigation, visualization, and writing – original draft preparation. Z.A. Baarmah and Dr A.N. Saqib: Validation, review, and editing. Dr S. Atik, I.O. Alosaimi, A.M. AlQarni, and H.A. Almalki: annotation work. Dr N. Hassan: supervision, project administration, and funding.
Data Availability
All datasets used are publicly accessible and require no special permissions: AneRBC dataset, available via Mendeley Data (DOI: 10.17632/hms3sjzt7f.1), includes 11,640 images from 354 patients alongside CBC and morphological data. TXL-PBC dataset, available on Figshare (DOI: 10.6084/m9.figshare.27073186.v8) and GitHub, integrates curated and re-annotated data from BCCD, BCDD, PBC, and Raabin-WBC.
AI Use Declaration
The authors utilized AI and computer vision technologies during manuscript preparation as follows: Model Training & Dataset Curation: The Roboflow computer vision platform (Roboflow Inc., Des Moines, IA, USA) was used to train the RF-DETR instance segmentation network and execute the pathologist-in-the-loop, semi-automated annotation pipeline, including automated polygon mask generation. Statistical Analysis & Visualization: Claude (Sonnet 4.6, Anthropic, San Francisco, CA) was accessed in May 2026 to assist with descriptive statistics and data visualization. The authors critically reviewed, verified, and edited all automated outputs and take full responsibility for the scientific integrity, accuracy, and final interpretations presented in this article.
| References | ▴Top |
- World Health Organization. The global prevalence of anaemia in 2011. Geneva: WHO; 2015.
- Settles B. Active learning literature survey. Computer Sciences Technical Report 1648. Madison: University of Wisconsin; 2010.
- Lewis JE, Pozdnyakova O. Digital assessment of peripheral blood and bone marrow aspirate smears. Int J Lab Hematol. 2023;45(Suppl 2):50-58.
doi pubmed - He K, Zhang X, Ren S, Sun J. Deep residual learning for image recognition. In: Proceedings of the IEEE Conference on Computer Vision and Pattern Recognition; 2016. p. 770-778.
- Dosovitskiy A, Beyer L, Kolesnikov A, et al. An image is worth 16x16 words: Transformers for image recognition at scale. arXiv preprint arXiv. 2020.
- Carion N, Massa F, Synnaeve G, Usunier N, Kirillov A, Zagoruyko S. End-to-end object detection with transformers. In: Proceedings of the European Conference on Computer Vision; 2020. p. 213-229.
- Gan L, Li X, Wang X. TXL-PBC dataset: TXL-PBC public peripheral blood smear image repository [Internet]. figshare; 2025 [cited Jun 9, 2026].
doi - Shahzad M, Shirazi SH, Yaqoob M, et al. AneRBC-II anemia image dataset [Internet]. Mendeley Data; 2024 [cited Jun 9, 2026].
doi - Shenggan. BCCD Dataset (Blood Cell Count and Detection) [Internet]. GitHub; 2018 [cited Jun 9, 2026]. Available from: https://github.com/Shenggan/BCCD_Dataset.
- Blood Cell Detection Dataset (BCDD) [Internet]. Kaggle; 2020 [cited Jun 9, 2026]. Available from: https://www.kaggle.com/datasets.
- Acevedo A, Merino A, Alferez S, Molina A, Boldu L, Rodellar J. A dataset of microscopic peripheral blood cell images for development of automatic recognition systems. Data Brief. 2020;30:105474.
doi pubmed - Shahzad M, Shirazi SH, Yaqoob M, Khan Z, Rasheed A, Ahmed Sheikh I, Hayat A, et al. AneRBC dataset: a benchmark dataset for computer-aided anemia diagnosis using RBC images. Database (Oxford). 2024;2024:baae120.
doi pubmed - Roboflow Inc. Roboflow computer vision platform [Internet]. San Francisco: Roboflow Inc; c2019-2026 [cited May 30, 2026]. Available from: https://roboflow.com.
- ClinicalTrials.gov. The role of IV iron (Ferric Carboxymaltose) and IM vitamin B12 (Hydroxycobalamin) supplementation in the management of anaemic prevalent Indian hemodialysis patients: a parallel group, quadruple blind, placebo-controlled, pragmatic randomized control trial with 2x2 factorial design. Identifier: NCT04627181. Available from: https://clinicaltrials.gov/study/NCT04627181.
- Anthropic. Claude (Sonnet 4.6) [Large language model]. San Francisco: Anthropic; 2026 [cited 2026 May]. Available from: https://www.anthropic.com.
- Navya KT, Verma S, Prasad K, Singh BMK. Efficient diagnostic model for iron deficiency anaemia detection: a comparison of CNN and object detection algorithms in peripheral blood smear images. Automatika. 2025;66(1):1-15.
doi - Naruenatthanaset K, Chalidabhongse TH, Palasuwan D, Anantrasirichai N, Palasuwan A. Red blood cell segmentation with overlapping cell separation and classification on imbalanced dataset. arXiv preprint arXiv:2012.01321. 2021.
- Sadafi A, Bordukova M, Makhro A, Navab N, Bogdanova A, Marr C. RedTell: an AI tool for interpretable analysis of red blood cell morphology. Front Physiol. 2023;14:1058720.
doi pubmed - Palmer L, Briggs C, McFadden S, Zini G, Burthem J, Rozenberg G, Proytcheva M, et al. ICSH recommendations for the standardization of nomenclature and grading of peripheral blood cell morphological features. Int J Lab Hematol. 2015;37(3):287-303.
doi pubmed - Clinical and Laboratory Standards Institute. Reference leukocyte (WBC) differential count (Proportional) and evaluation of instrument methods; Approved Standard, 2nd ed. CLSI document H20-A2. Wayne, PA: CLSI; 2007.
- Urrechaga E, Borque L, Escanero JF. Erythrocyte and reticulocyte indices in the assessment of erythropoiesis activity and iron availability. Int J Lab Hematol. 2013;35(2):144-149.
doi pubmed - Nalado AM, Mahlangu JN, Duarte R, Paget G, Olorunfemi G, Jacobson BF, Naicker S. Utility of reticulocyte haemoglobin content and percentage hypochromic red cells as markers of iron deficiency anaemia among black CKD patients in South Africa. PLoS One. 2018;13(10):e0204899.
doi pubmed
This article is distributed under the terms of the Creative Commons Attribution 4.0 International License (CC BY 4.0), which permits unrestricted use, distribution, and reproduction in any medium, including commercial use, provided the original work is properly cited.
AI in Clinical Medicine is published by Elmer Press Inc.