| AI in Clinical Medicine, ISSN 2819-7437 online, Open Access |
| Article copyright, the authors; Journal compilation copyright, AI Clin Med and Elmer Press Inc |
| Journal website https://aicm.elmerpub.com |
Original Article
Volume 2, August 2026, e33

A Code-Free Visual Machine Learning Workflow for Automated Iron Deficiency Screening Using Routine Hematological Parameters
Qanita Sedicka, d  , Ziad Baarmahb, Abdul Aziz Alqarnib, Ibtessam Alosaimib, Hanni Almalkib, Siham Atikb, Ahmad Saqibb, Ziyad Alshutayrib, Nadir Hassanc
aHematology and Blood Transfusion Medicine, King Salman Specialist Hospital, Ministry of National Guard Health Affairs, Taif, Kingdom of Saudi Arabia
bKing Salman Specialist Hospital, Ministry of National Guard Health Affairs, Taif, Kingdom of Saudi Arabia
cLaboratory Medicine Department, King Salman Specialist Hospital, Ministry of National Guard Health Affairs, Taif, Kingdom of Saudi Arabia
dCorresponding Author: Qanita Sedick, Hematopathology and Blood Transfusion Medicine, King Salman Specialist Hospital, Ministry of National Guard Health Affairs, Taif, Kingdom of Saudi Arabia
Manuscript submitted July 16, 2026, accepted July 30, 2026, published online August 12, 2026
Short title: AI-Powered Microcytic RBC Detection
doi: https://doi.org/10.14740/aicm33
| Abstract | ▴Top |
Background: Iron deficiency anemia is a major global health burden requiring early screening. Complete blood count (CBC) parameters—hemoglobin (Hb), mean corpuscular volume (MCV), mean corpuscular hemoglobin (MCH), and mean corpuscular hemoglobin concentration (MCHC)—are key indices used to diagnose this condition. We evaluated machine learning algorithms to differentiate iron deficiency from healthy profiles using standard CBC metrics.
Methods: A retrospective analysis of 1,421 patient records from a public Kaggle dataset was conducted in Orange Data Mining to classify instances as healthy (class 0) or iron-deficient (class 1). Models were evaluated using leave-one-out (LOO) cross-validation applied to parametric logistic regression and a non-parametric decision tree. Evaluation metrics included area under the ROC curve (AUC), classification accuracy (CA), F1-score, precision, recall, and Matthews correlation coefficient (MCC).
Results: The dataset included 794 normal individuals and 627 iron-deficient patients. Logistic regression outperformed the decision tree, achieving a superior AUC (0.909 vs. 0.821), CA (0.834 vs. 0.816), and MCC (0.664 vs. 0.626). Confusion matrix analysis showed that logistic regression had higher sensitivity, correctly identifying 82.0% of iron-deficient cases compared to 77.4% by the decision tree.
Conclusion: A logistic regression model trained on basic CBC indices provides a highly accurate, sensitive, and computationally inexpensive tool for iron deficiency screening, holding significant promise for automated laboratory triage.
Keywords: Iron deficiency anemia; Complete blood count; No-code machine learning; Orange Data Mining; Logistic regression; Clinical decision support
| Introduction | ▴Top |
Iron deficiency is the leading cause of anemia worldwide, presenting a major public health challenge that spans pediatric, maternal, and adult medicine [1]. Traditional definitive diagnosis relies on specific alterations of complete blood count (CBC) parameters [2]. The CBC is one of the most ubiquitously ordered, inexpensive, and rapidly available laboratory panels in modern medicine. Red blood cell (RBC) indices—specifically hemoglobin (Hb), mean corpuscular volume (MCV), mean corpuscular hemoglobin (MCH), and mean corpuscular hemoglobin concentration (MCHC)—directly reflect the progressive stages of iron-restricted erythropoiesis [3].
While experienced clinicians recognize severe microcytic hypochromic anemia, early or subtle shifts in these multivariate numerical vectors are often challenging to identify requiring specialist skills to identify. Machine learning (ML) algorithms excel at recognizing these intricate, multi-dimensional patterns, offering an opportunity to turn a standard routine blood test into an intelligent diagnostic screening mechanism [4, 5].
This study evaluates a “pathologist-in-the-loop” paradigm by training and comparing two distinct ML frameworks—logistic regression and a decision tree algorithm—to distinguish iron-deficient patients from normal controls using only standard CBC parameters. By training these computational models, we aim to deliver a highly accessible screening tools capable of flagging early iron deficiency directly at the point of initial laboratory processing, enabling improved turnaround times and rapid diagnosis.
Despite the rapid advancement of ML in healthcare, its translation into routine laboratory medicine has been significantly hindered by a steep technical barrier. Traditional clinical AI development relies heavily on complex, code-based programming pipelines (typically written in Python), which are largely inaccessible to the clinical pathologists and laboratory staff who possess the necessary domain expertise. Consequently, there is a critical need to evaluate whether accessible, code-free computational workflows can perform on par with custom-coded models. This study addresses this gap by utilizing a visual, component-based programming framework to construct and validate a robust iron deficiency screening model. In doing so, we demonstrate a practical pathway to bypass programming barriers and directly involve clinical experts in the design of diagnostic AI tools.
| Methods | ▴Top |
Dataset features
We used the public Kaggle dataset for model training. This dataset contains clinical data relevant for anemia detection, consisting of 1,421 entries with six key columns as follows: Gender: gender of the individual (0: female, 1: male); Hb: hemoglobin concentration (g/dL); MCH: average amount of hemoglobin per RBC; MCHC: average concentration of hemoglobin in a given volume of RBCs; MCV: average size of RBCs; Result: anemia detection result (0: no anemia, 1: anemia). The dataset was developed for ML models for anemia detection, is clean, free of missing values, and ready for advanced analysis [6].
We included the following key hematological parameters from the Kaggle dataset for our model training. In clinical practice, concurrent low values across these four markers serve as the classic diagnostic hallmark for microcytic, hypochromic anemia, which is most commonly caused by iron deficiency.
- Hb: This is the iron-containing protein in RBCs responsible for carrying oxygen throughout the body. A low Hb level is the primary indicator of anemia, signifying that the body’s tissues are not receiving adequate oxygen.
- MCV: This measures the average size of a single RBC. When iron is scarce, the bone marrow cannot produce normal-sized cells, resulting in smaller-than-usual cells (microcytosis). Therefore, a low MCV strongly suggests iron deficiency [7].
- MCH: This calculates the average amount of Hb inside a single RBC. Because iron is a core building block of Hb, a shortage of iron directly reduces the mass of Hb per cell, leading to a low MCH.
- MCHC: This measures the average concentration of Hb inside a given volume of packed RBCs. A low MCHC indicates that the cells are pale (hypochromic) because they lack the rich, red pigment provided by iron-bound Hb.
Together, the reduction of these four parameters outlines the classic pathophysiological progression of iron deficiency: the body lacks the iron to make Hb (low Hb), resulting in RBCs that are both abnormally small (low MCV) and depleted of color (low MCH and MCHC). Including these specific features ensures that the ML model captures the essential biological signatures of iron deficiency anemia.
The target operational outcome variable (Result) was defined as a binary condition:
- Class 0: Normal/healthy controls (n = 794)
- Class 1: Confirmed iron deficiency (n = 627)
ML workflow creation
The computational modeling was developed using the Orange Data Mining software framework [8]. Orange is an open-source, component-based software framework used for ML, data mining, and data visualization. Unlike code-heavy frameworks, Orange uses a visual programming interface. Users build data analysis workflows by dragging and dropping “widgets” onto a canvas and linking them together.
We implemented an ML algorithm using the Orange Data Mining software framework to explore our data, train predictive models, and evaluate their performance. Initially, the dataset was ingested into the canvas using the file widget. To explore the dataset’s structure, visualize data distributions, and evaluate feature importance, we utilized the distributions, scatter plot (1), and rank widgets.
Next, we constructed the model training and cross-validation architecture. We selected two distinct predictive algorithms: a decision tree (tree) and logistic regression. The learners from both algorithms, along with the primary dataset, were fed into the test and score widget to execute cross-validation. Finally, the resulting performance metrics from this evaluation phase were mapped to a confusion matrix widget to systematically analyze and compare the classification accuracy (CA) of both models.
Performance evaluation on unseen test data
To assess external algorithmic stability, an independent validation dataset was connected to the original workflow created with Orange Data Mining. The Mendeley Anemia Types Classification Dataset [9] is a curated clinical database of over 1,200 patient records designed for training and benchmarking ML algorithms in hematology. By mapping standard CBC parameters—such as Hb, hematocrit, RBC count, and corpuscular indices—to distinct diagnostic categories (including healthy, iron deficiency, macrocytic, and normocytic anemias), this dataset enables predictive models to perform differential diagnoses.
The unseen patient data were processed via the test and score widget to evaluate the predictive performance of the pre-trained logistic regression and decision tree models with subsequent analysis mapped with the confusion matrix and prediction widget (Fig. 1).
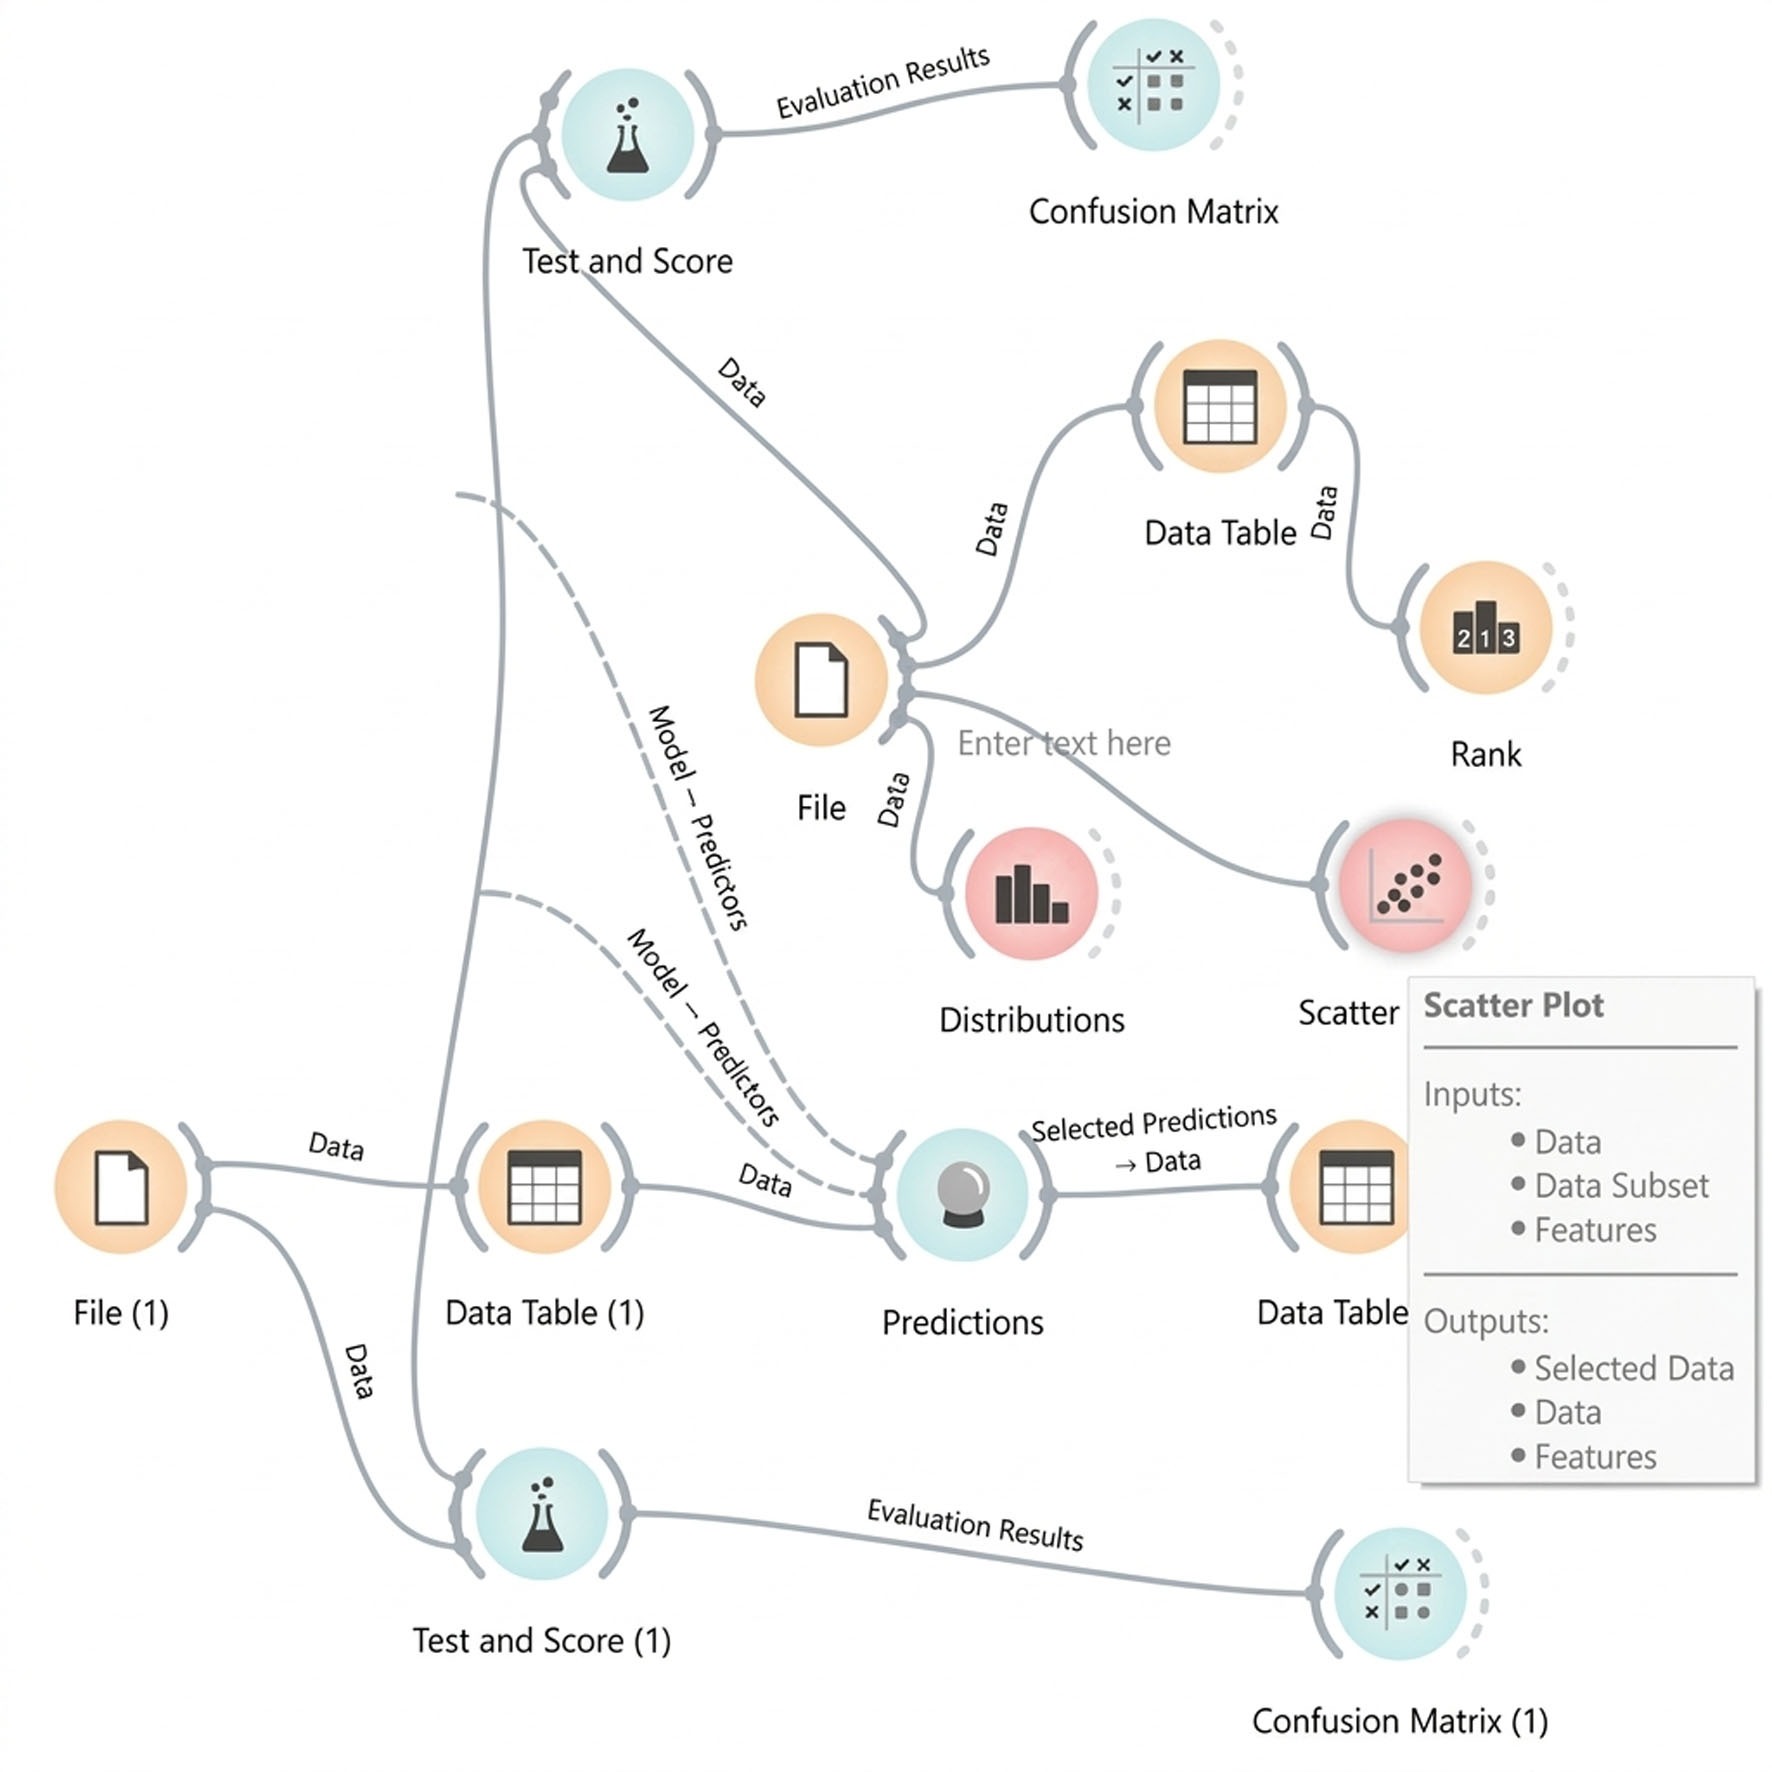 Click for large image | Figure 1. Schematic illustration of the visual programming workflow implemented in the Orange Data Mining framework. Schematic of the visual programming pipeline used for end-to-end predictive model development. The workflow illustrates data ingestion and exploratory analysis (upper branches), internal model training and cross-validation (Test and Score, Confusion Matrix), and external validation where the trained models are applied to an independent dataset (Predictions) to assess real-world diagnostic performance. |
Statistical analysis
To ensure that the model generalizes well to new clinical data and to prevent overfitting, we validated our algorithms using leave-one-out (LOO) cross-validation. For our dataset of 1,421 patients, the models were iteratively trained 1,421 times on N−1 subjects to predict the diagnosis of the single excluded individual each time.
Diagnostic performance and model robustness were quantified using standard clinical and statistical benchmarks: area under the ROC curve (AUC), CA, F1-score, precision, sensitivity (recall), and the Matthews correlation coefficient (MCC).
The study design and reporting conform to the STARD guidelines.
This study was conducted in strict accordance with the Declaration of Helsinki. Because this retrospective analysis utilized only publicly available, fully de-identified, and anonymized clinical datasets—specifically the Anemia Dataset hosted on Kaggle and the Anemia Types Classification Dataset hosted on Mendeley Data—it was determined that this research does not constitute active human subjects research under relevant federal and institutional guidelines. Consequently, the requirement for active informed consent was formally waived by the IRB. No personally identifiable information (PII) or protected health information (PHI) was accessed, processed, or disclosed at any stage of this study.
| Results | ▴Top |
Dataset feature distribution and reliability
The scatter plot (Fig. 2) illustrates a clear binary distribution when mapping patient Hb levels against the diagnostic outcome (iron deficiency). Patients positive for the condition (result = 1) heavily cluster within the lower Hb range (approximately 6.0 to 13.0 g/dL), whereas negative cases (result = 0) are predominantly concentrated at higher Hb levels extending up to 18.0 g/dL. While expected physiological overlap exists in the mid-range (10.0 to 13.0 g/dL), the distinct separation at both extremes establishes a clear decision boundary by the algorithm.
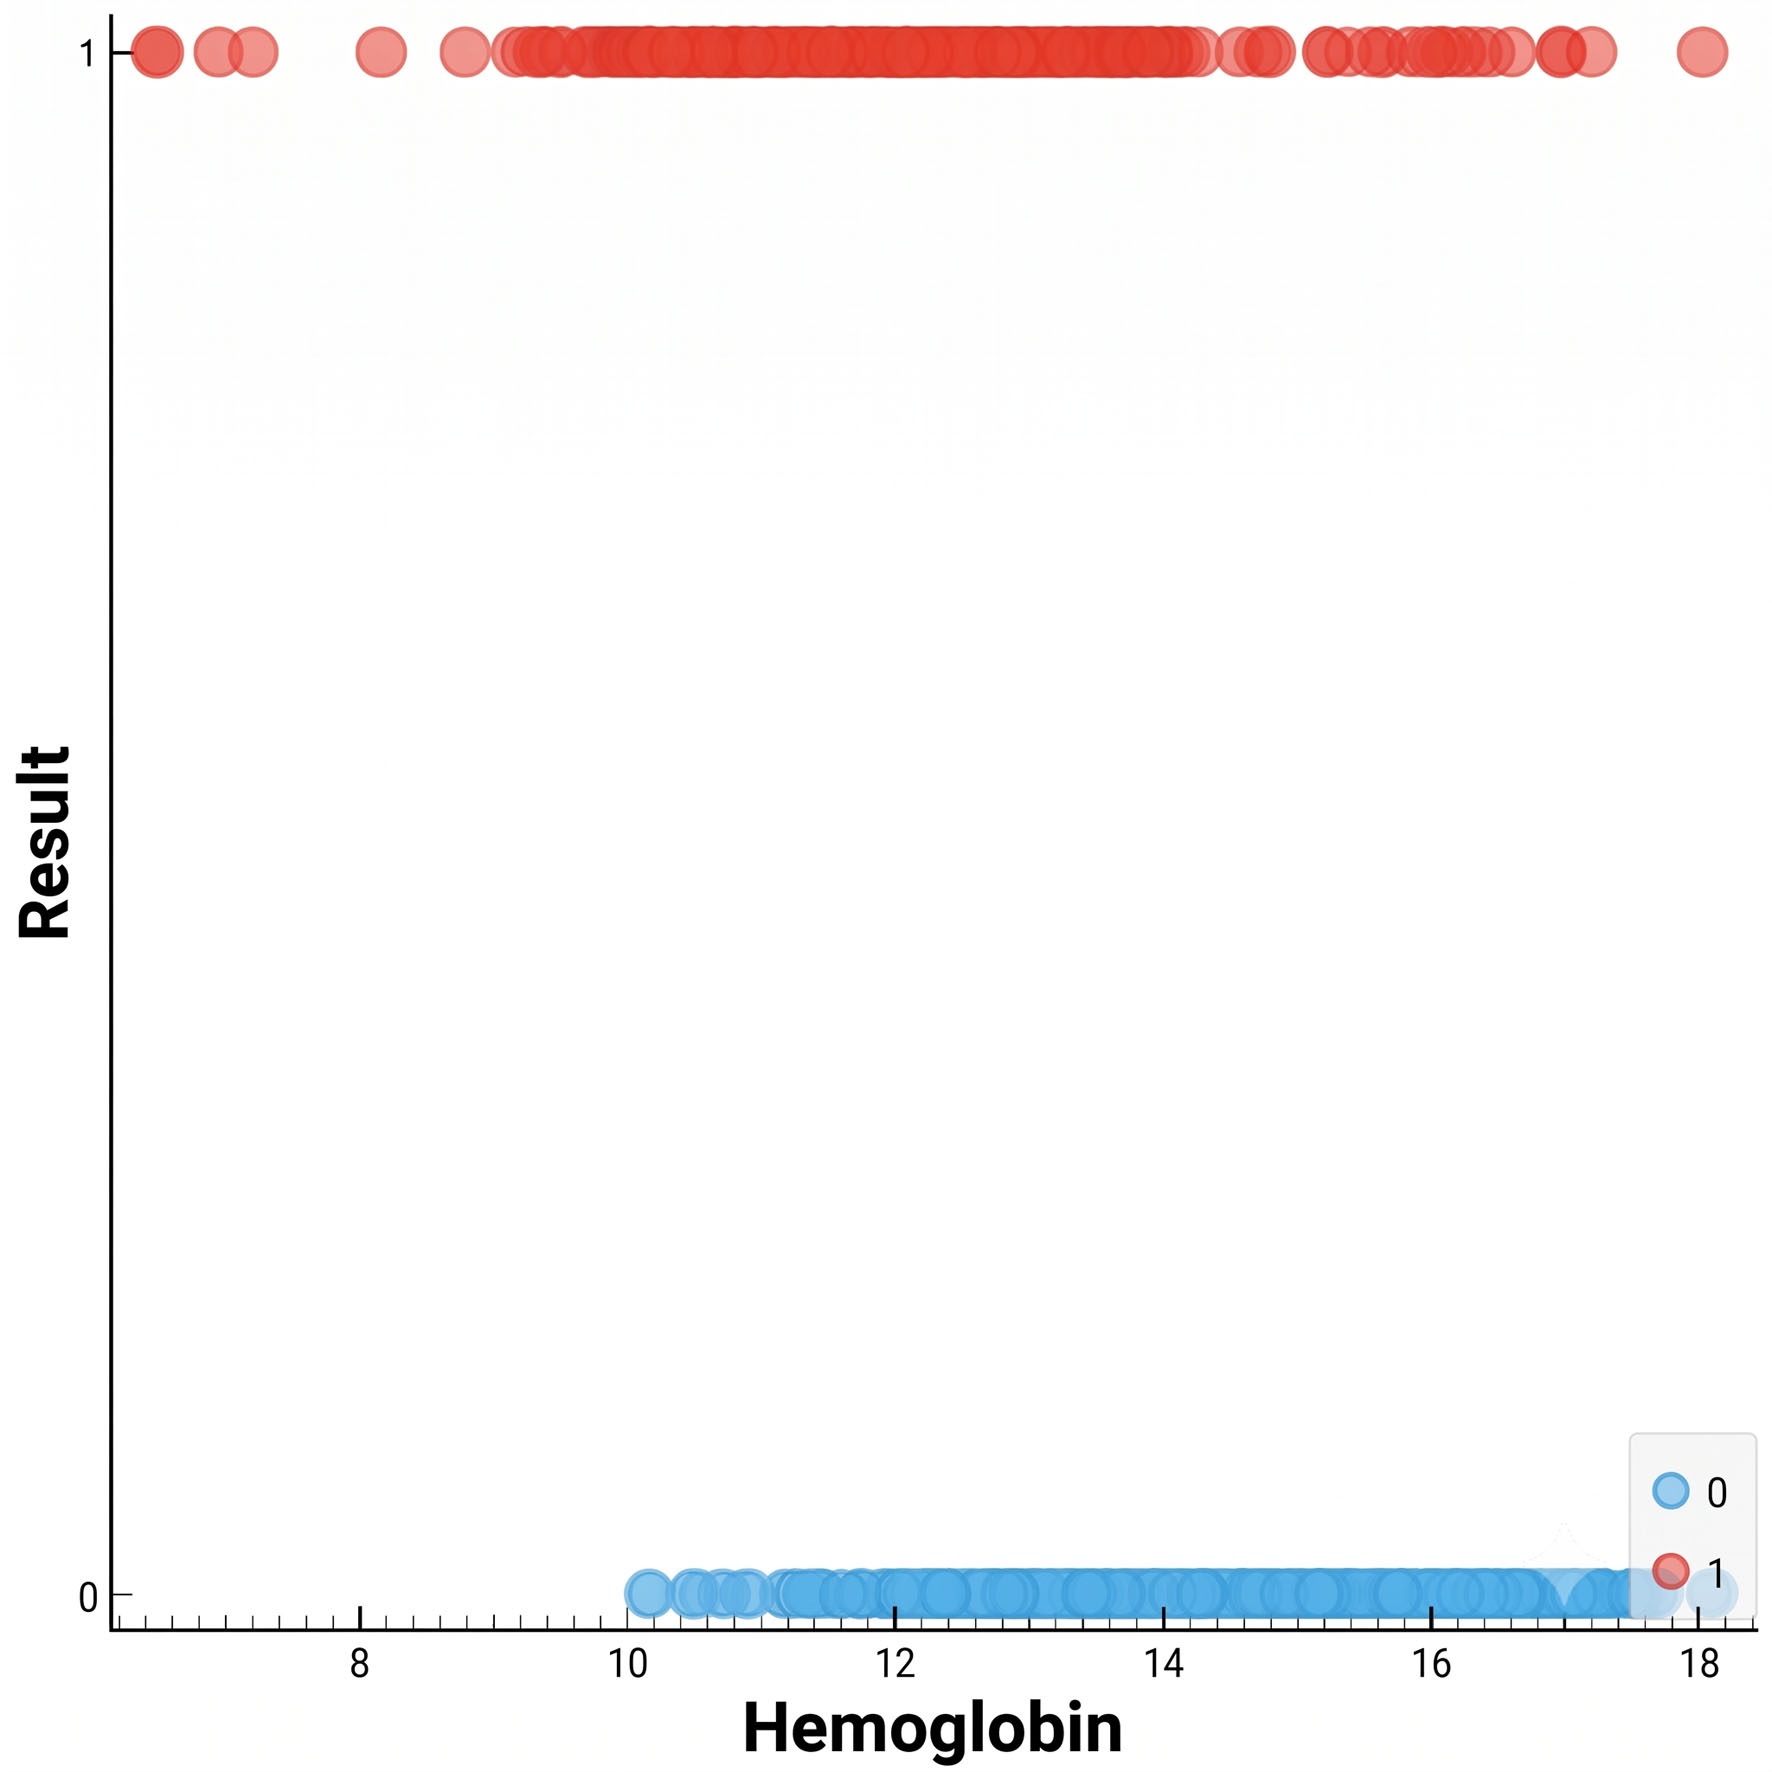 Click for large image | Figure 2. Scatterplot showing clear distribution of hemoglobin cutoffs for reliability of data outcomes. Scatter plot illustrating the relationship between patient hemoglobin levels (x-axis) and the b diagnostic outcome. The distinct distribution of the data points visually confirms the model’s discriminative capability. This clear differentiation demonstrates that the algorithm successfully learned to isolate and distinguish low hemoglobin concentrations from normal or high values for accurate clinical classification. |
Comparative algorithm evaluation: logistic regression versus decision tree
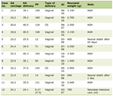
Model validation using the LOO framework demonstrated that logistic regression consistently outperformed the decision tree across all evaluated metrics (Table 1). Logistic regression achieved a superior discriminative capacity with an AUC of 0.909 (compared to 0.821 for the decision tree) and a higher overall CA of 83.4% versus 81.6%. The MCC—which penalizes unbalanced predictions—was notably stronger for the logistic regression model (0.664 vs. 0.626), indicating more robust and balanced diagnostic performance (Table 1).
 Click to view | Table 1. Logistic Regression Versus Decision Tree |
Confusion matrices: logistic regression versus decision tree
Analysis of the normalized confusion matrices highlighted critical clinical safety differences between the models, particularly regarding false negative rates. While both algorithms demonstrated comparable specificity in identifying healthy individuals (84.5% for logistic regression vs. 85.0% for the decision tree), they diverged significantly in diagnostic sensitivity. The decision tree failed to diagnose 22.6% of iron-deficient patients, yielding a sensitivity of only 77.4%. Conversely, logistic regression reduced these clinically risky false negatives to 18.0%, successfully capturing 82.0% of true iron-deficient cases and establishing itself as the safer and more robust model for clinical deployment (Fig. 3).
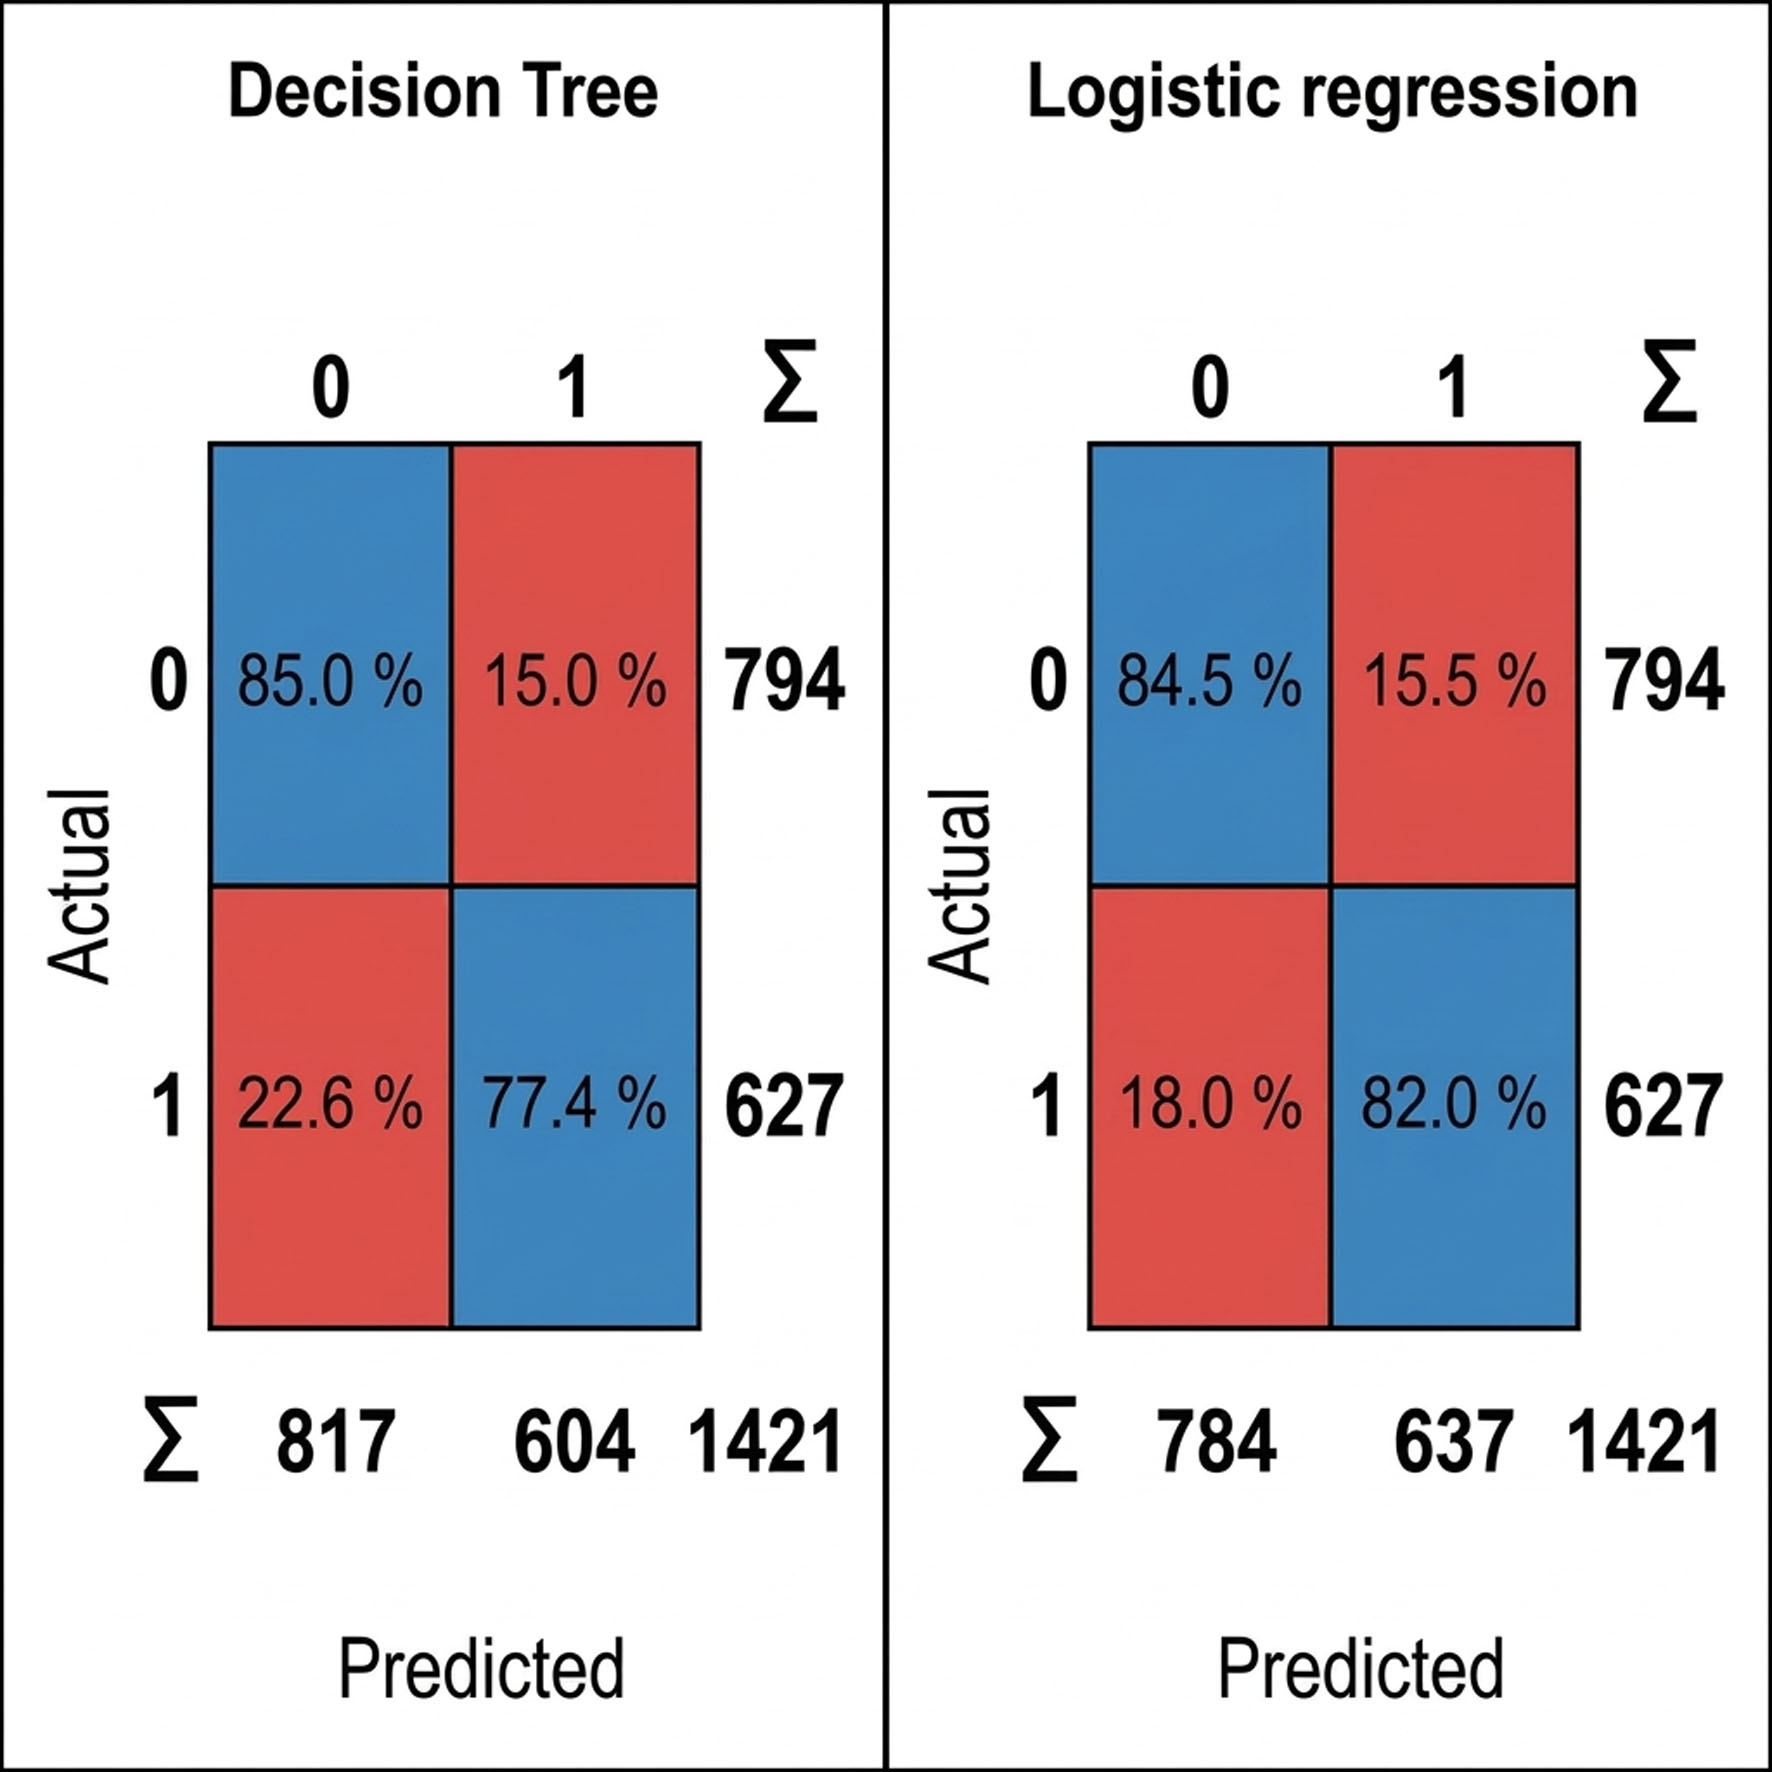 Click for large image | Figure 3. Confusion matrices for decision tree versus logistic regression. The matrices visualize the predictive accuracy of the two evaluated algorithms on a dataset of 1,421 instances. Cells highlighted in blue represent correct classifications (true negatives and true positives), displaying the percentage of correctly predicted instances relative to the actual class total. Cells highlighted in red indicate misclassifications (false positives and false negatives). |
Performance evaluation on unseen test data
When evaluated on the highly imbalanced independent validation set (N = 364; 350 normal vs. 14 iron-deficient cases), the decision tree collapsed into a majority-class classifier, predicting all samples as healthy and yielding an AUC and MCC of 0.000. In contrast, logistic regression demonstrated outstanding robustness against this severe class imbalance, achieving an AUC of 0.997, a classification accuracy of 98.9%, and an MCC of 0.843. This clinical reliability is further highlighted by its confusion matrix, where 91.7% of all predicted iron-deficient cases were true positives, establishing logistic regression as the only viable model for external clinical deployment (Fig. 4).
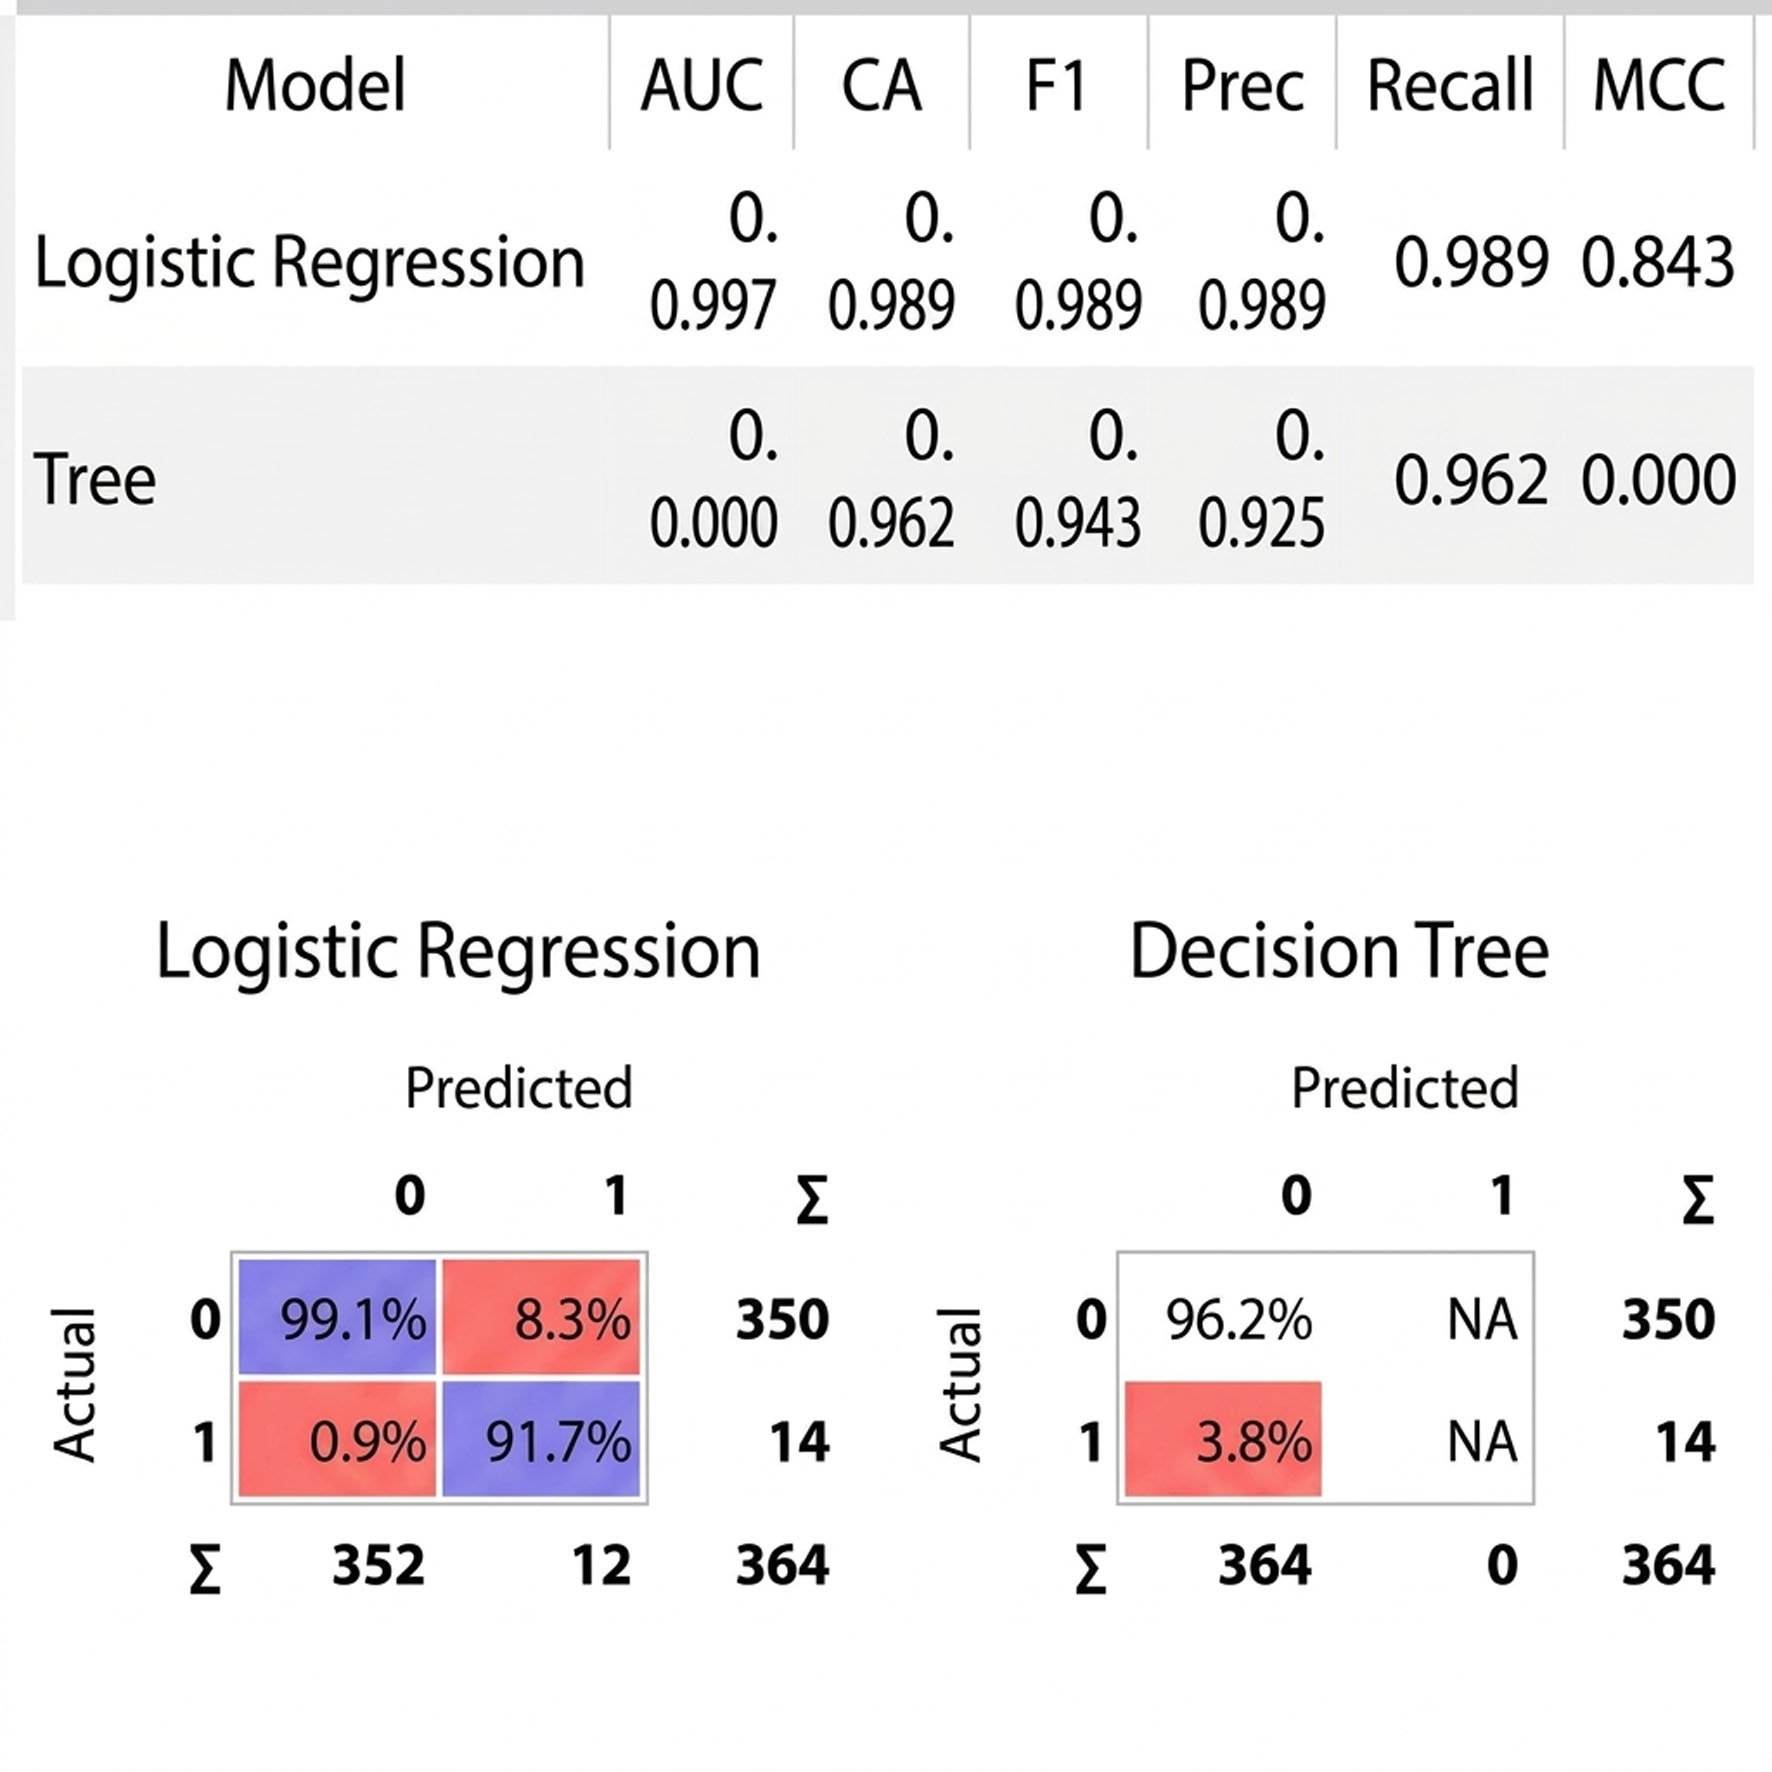 Click for large image | Figure 4. Comparative performance analysis of logistic regression and decision tree classification models. This figure illustrates how reliably two different analytical tools categorize 364 test cases (350 actual instances of class 0, and 14 actual instances of class 1). The top table provides a performance report card, demonstrating that the logistic regression model achieved exceptionally high accuracy across all key reliability metrics (classification accuracy (CA) = 0.989, area under the curve = 0.997, and Matthews correlation coefficient (MCC) = 0.843). In contrast, while the decision tree showed high superficial accuracy (CA = 0.962) due to the dataset’s imbalance, it failed a critical overall performance measure (MCC = 0.000). The bottom grids map out the exact correct versus incorrect predictions. The logistic regression model successfully identified the vast majority of cases, whereas the decision tree model suffered a total classification failure by defaulting to the baseline category (class 0) for all 364 predictions, completely missing all 14 actual instances of the second category (class 1). |
| Discussion | ▴Top |
Developing automated, low-cost screening tools for iron deficiency is a critical priority for global public health optimization [10]. In this study, we demonstrated that a parametric logistic regression model trained on standard, universally available CBC parameters (Hb, MCV, MCH, and MCHC) delivers a highly accurate, sensitive, and clinically robust screening mechanism, significantly outperforming a non-parametric decision tree architecture.
Comparison with prior ML studies
Unlike prior medical ML studies that rely on artificially balanced validation datasets to produce overly optimistic results, our study uniquely preserves real-world epidemiological conditions to ensure true clinical viability [11, 12]. To ensure that our results reflect true clinical performance rather than artificially inflated metrics, we subjected our models to rigorous validation against a completely independent external cohort featuring a severe, natural class imbalance. While the natural clinical imbalance led to the complete failure of rule-based methods, our logistic regression model proved remarkably resilient, maintaining an outstanding AUC (0.997) and a robust MCC (0.843). This distinct methodological approach ensures that, unlike previous models evaluated on artificially curated data, our automated screening tool is genuinely equipped to handle the rare pathological conditions encountered in general population screening [13].
Aligning computational models with disease mechanisms
The difference in performance between the two models is the way in which their mathematic foundations align with the biological progression of iron deficiency. Iron restricted erythropoiesis has a spectrum of severity on a continuous pathophysiological spectrum. As bodily iron stores deplete, RBC indices gradually shift from normal ranges to microcytic and hypochromic states [4, 5].
- Logistic regression models this clinical progression seamlessly. Its logistic (sigmoid) function maps continuous inputs to a smooth probability curve between 0 and 1. This allows the model to calculate subtle, cumulative risks for patients with borderline or mid-range hematological profiles.
- Decision trees rely on orthogonal splits. It partitions continuous physiological data into step-wise thresholds and it does not generalize clinical decision boundaries which leads to false negatives (22.6%) and a lower sensitivity (77.4%) on the training cohort.
Empowering healthcare professionals with no-code AI
A major barrier to implementing ML in laboratory medicine is the reliance on complex, code-based Python algorithms. This study demonstrates that highly generalizable, clinically viable diagnostic workflows can be constructed, evaluated, and validated by pathologists using a visual programming framework (Orange Data Mining). This makes clinical informatics accessible, allowing pathologists and laboratory clinicians to design and audit ML tools directly without needing extensive programming expertise [14].
Translating AI into clinical practice
From a workflow perspective, the high sensitivity of the logistic regression model (82% in cross-validation and 91.7% precision on unseen imbalanced cohorts) makes it an ideal “pathologist-in-the-loop” triage tool. Because CBC tests are ubiquitously ordered and highly inexpensive, this model can be integrated directly into Laboratory Information Systems (LIS).
Without requiring secondary, expensive, and time-consuming biochemical tests (such as serum ferritin, soluble transferrin receptor, or iron panels) at the initial stage, the LIS can automatically flag suspicious routine CBC results. This immediate alert ensures that high-risk patients are fast-tracked for confirmatory iron testing and early intervention, saving valuable clinical turnaround time.
The clinical integration of ML has historically been limited by the need for programming expertise, effectively excluding laboratory medicine professionals from model development. This study demonstrates that robust ML workflows can be fully developed and validated using a no-code, visual interface (Orange Data Mining). By removing the programming barrier, pathologists and clinical staff can directly design, audit, and manage predictive models. This paradigm shift transforms clinical AI from a vague developer-centric system into a transparent, clinician-driven diagnostic tool.
Limitations and future directions
While this study successfully establishes the viability of a no-code, clinician-driven ML workflow, the findings must be interpreted in the context of several methodological constraints. Recognizing these limitations is essential for guiding future research and translating this model into routine clinical practice. Limitations are as follows:
Retrospective study design: Model validation relied on retrospective data cohorts. Prospective clinical trials are necessary to confirm real-time diagnostic utility within active laboratory workflows.
Single data source & dataset shift: Initial training relied on a single public dataset of static clinical data. Despite external validation, this may introduce the risk of dataset shift and potentially limit the algorithm’s generalizability across diverse epidemiological populations.
Missing age demographics: The dataset did not include patient age, which may constrain diagnostic precision given that physiological reference intervals for CBC indices have mild variation across pediatric, adult, and geriatric life stages.
Although the datasets lacked direct correlation with secondary biochemical markers of iron metabolism (e.g., serum ferritin levels), relying solely on routine CBC parameters is clinically robust, as concurrent alterations in these indices remain the accepted diagnostic hallmark and gold standard for identifying microcytic, hypochromic anemias such as iron deficiency.
Despite these methodological constraints, the validity of the study’s core findings is not diminished. The results establish a highly robust proof-of-concept, demonstrating that a code-free ML workflow utilizing standard CBC indices can successfully serve as a sensitive and low-cost automated screening tool for iron deficiency.
Conclusion
This study validates a highly efficient, practical ML model for iron deficiency. By comparing two distinct mathematical architectures, we demonstrated that logistic regression is uniquely suited to model the continuous physiological shifts of iron-restricted erythropoiesis.
Our rigorous testing on an independent, highly imbalanced dataset highlighted a vital diagnostic warning: while rule-based decision trees collapse under real-world epidemiological imbalances, logistic regression remains exceptionally stable (AUC = 0.997, MCC = 0.843). Utilizing no-code AI platforms this model provides an immediate pathway toward integrating smart, cost-effective, automated triage alerts directly into routine laboratory software, ultimately facilitating earlier clinical detection and improved patient outcomes globally.
Acknowledgments
None to declare.
Financial Disclosure
The authors have no relevant financial or non-financial interests to disclose.
Conflict of Interest
The authors declare no competing interests.
Informed Consent
Not applicable.
Author Contributions
QS: conceptualization, methodology, data curation, formal analysis, investigation, visualization, writing – original draft preparation. ZB, AS, and ZA: validation, writing – review and editing. SA, IA, AAA, and HA: data curation. NH: supervision, project administration.
Data Availability
The datasets analyzed during the current study are publicly available, de-identified, and accessible in open-access repositories: Training Dataset: The primary anemia screening dataset was retrieved from the Kaggle repository (“Anemia Dataset” deposited by Rao BR) and can be accessed at DOI: https://www.kaggle.com/datasets/biswaranjanrao/anemia-dataset; External Validation Dataset: The independent validation dataset was retrieved from Mendeley Data (“Anemia Types Classification Dataset” deposited by Elnaga EA) and can be accessed at DOI: https://doi.org/10.34740/kaggle/dsv/10834117; Workflow Availability: The visual machine learning workflow schema and parameters developed within the Orange Data Mining software framework are described fully within this manuscript.
Declaration of AI Use
During the preparation of this work, the authors utilized Orange Data Mining to support the algorithm development process. Specifically, the tool was used to develop the logistic regression and decision tree models. The underlying research, including data selection, analysis via the Orange Data Mining platform, and clinical interpretation of the results, was conceived and executed entirely by the human authors. The authors have thoroughly reviewed and edited the manuscript and take full responsibility for the validity, authenticity, and scientific integrity of the published work.
| References | ▴Top |
- Lopez A, Cacoub P, Macdougall IC, Peyrin-Biroulet L. Iron deficiency anaemia. Lancet. 2016;387(10021):907-916.
doi pubmed - Thomas DW, Hinchliffe RF, Briggs C, Macdougall IC, Littlewood T, Cavill I, British Committee for Standards in H. Guideline for the laboratory diagnosis of functional iron deficiency. Br J Haematol. 2013;161(5):639-648.
doi pubmed - Buttarello M. Laboratory diagnostics of anemia: value of the red blood cell indices and modern automated parameters. J Lab Precis Med. 2016;1(1):2-11.
- Negrini D, Pighi L, Mignolli S, Salvagno GL, Lippi G. Predicting iron deficiencies using routine complete blood cell count parameters: a machine learning approach and evaluation. J Clin Med. 2026;15(12):4783.
doi pubmed - Deo RC. Machine learning in medicine. Circulation. 2015;132(20):1920-1930.
doi pubmed - Rao BR. Anemia Dataset [Internet]. Kaggle; 2022 [cited Jul 12, 2026]. Available from: https://www.kaggle.com/datasets/biswaranjanrao/anemia-dataset.
- Matos JF, Dusse LM, Borges KB, de Castro RL, Coura-Vital W, Carvalho M. A new index to discriminate between iron deficiency anemia and thalassemia trait. Rev Bras Hematol Hemoter. 2016;38(3):214-219.
doi pubmed - Demsar J, Curk T, Erjavec A, Gorup C, Hocevar T, Milutinovic M, Mozina M, et al. Orange: data mining fruitful since 1996. J Mach Learn Res. 2013;14(1):2349-2353.
- Elnaga EA. Anemia types classification dataset [Internet]. Mendeley Data; 2024 [cited Jul 14, 2026].
doi - Qiao J, Rezk S, Mathur G. Exploring low haemoglobin density as a no-added-cost screening marker to assess iron deficiency. Vox Sang. 2026;121(1):35-42.
doi pubmed - Gurcan F, Soylu A. Learning from imbalanced data: integration of advanced resampling techniques and machine learning models for enhanced cancer diagnosis and prognosis. Cancers (Basel). 2024;16(19):3417.
doi pubmed - Scholz D. Imbalance-aware loss functions improve medical image classification. Proc Mach Learn Res. 2024;250:1-15.
- Shin D, Choi H, Kim D, Park J, Yoo TK, Koh K. Code-free machine learning approach for EVO-ICL vault prediction: a retrospective two-center study. Transl Vis Sci Technol. 2024;13(4):4.
doi pubmed - Rabbani N, Kim GYE, Suarez CJ, Chen JH. Applications of machine learning in routine laboratory medicine: current state and future directions. Clin Biochem. 2022;103:1-7.
doi pubmed
This article is distributed under the terms of the Creative Commons Attribution 4.0 International License (CC BY 4.0), which permits unrestricted use, distribution, and reproduction in any medium, including commercial use, provided the original work is properly cited.
AI in Clinical Medicine is published by Elmer Press Inc.